. 2009 Aug 15;125(4):816-25.
doi: 10.1002/ijc.24347.

Downregulation of connective tissue growth factor by three-dimensional matrix enhances ovarian carcinoma cell invasion

Affiliations

Downregulation of connective tissue growth factor by three-dimensional matrix enhances ovarian carcinoma cell invasion

Maria V Barbolina et al. Int J Cancer. .

Abstract

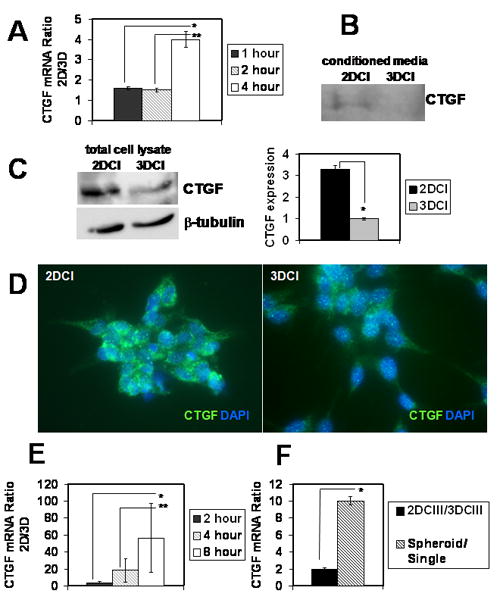
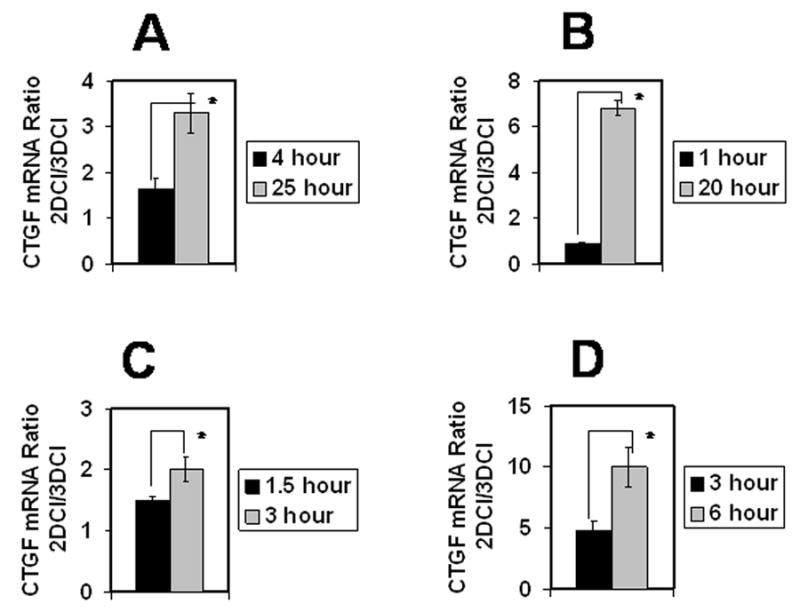
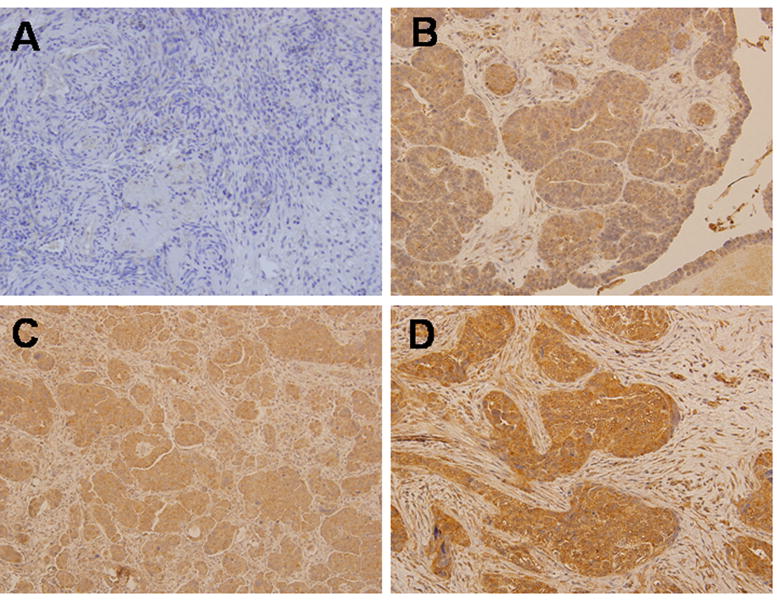
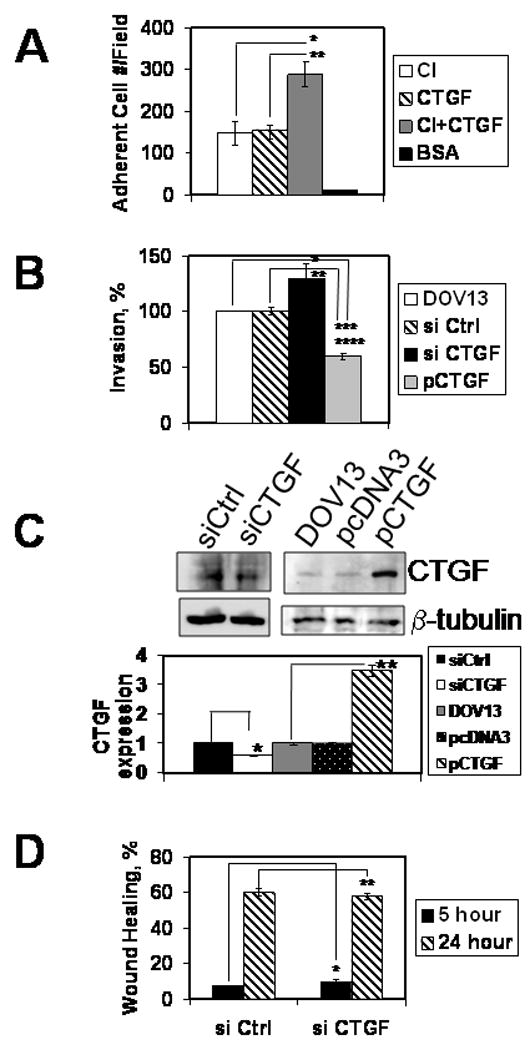
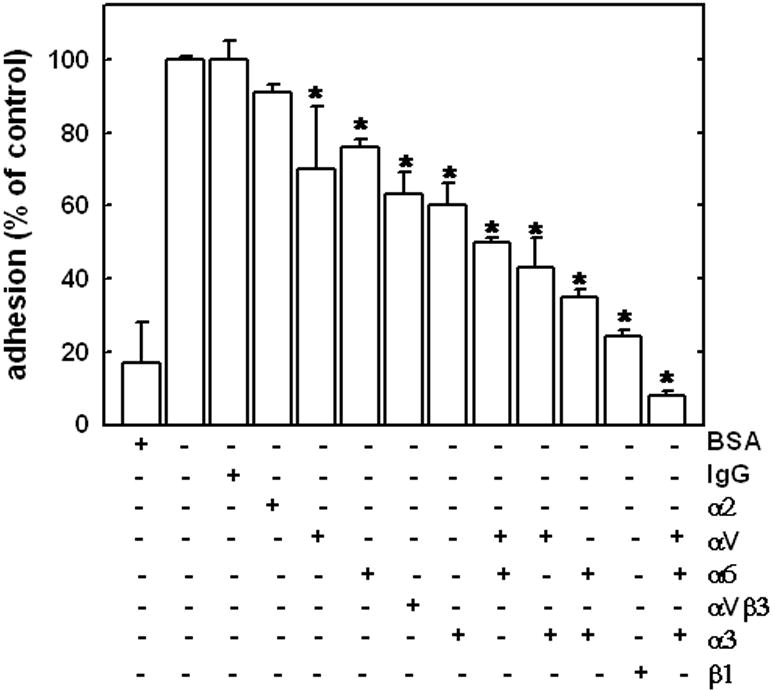
Epithelial ovarian carcinoma (EOC) is a leading cause of death from gynecologic malignancies, due mainly to the prevalence of undetected metastatic disease. The process of cell invasion during intraperitoneal anchoring of metastatic lesions requires concerted regulation of many processes, including modulation of adhesion to the extracellular matrix and localized invasion. Exploratory cDNA microarray analysis of early response genes (altered after 4 hr of 3D collagen culture) coupled with confirmatory real-time reverse-transcriptase polymerase chain reaction, multiple 3D cell culture matrices, Western blot, immunostaining, adhesion, migration and invasion assays were used to identify modulators of adhesion pertinent to EOC progression and metastasis. cDNA microarray analysis indicated a dramatic downregulation of connective tissue growth factor (CTGF) in EOC cells placed in invasion- mimicking conditions (3D Type I collagen). Examination of human EOC specimens revealed that CTGF expression was absent in 46% of the tested samples (n = 41), but was present in 100% of normal ovarian epithelium samples (n = 7). Reduced CTGF expression occurs in many types of cells and may be a general phenomenon displayed by cells encountering a 3D environment. CTGF levels were inversely correlated with invasion such that downregulation of CTGF increased, while its upregulation reduced collagen invasion. Cells adhered preferentially to a surface comprised of both collagen I and CTGF relative to either component alone using alpha6beta1 and alpha3beta1 integrins. Together these data suggest that downregulation of CTGF in EOC cells may be important for cell invasion through modulation of cell-matrix adhesion.


Figures

Figure 1
Figure 1. Expression of CTGF is downregulated by three-dimensional environment
(A) DOV13 cells respond to three-dimensional collagen I culture with downregulation of CTGF mRNA after 4 hours of culture. Cells were cultured for indicated periods of time on 3DCI and 2DCI and collected for extraction of total RNA and subsequent cDNA synthesis. Real time RT-PCR was performed to detect CTGF expression. Histogram depicts ratios of CTGF mRNA in cells cultured on 2DCI compared to those on 3DCI using 2-ΔΔCt method. Ratio >1 reflects downregulation of CTGF expression on 2DCI versus 3DCI. *, **, p<0.05 Secreted (B) (into conditioned media) and total (C) CTGF protein is downregulated in cells cultured on 3DCI compared to those on 2DCI for 24-48 hours. Anti-human CTGF antibody (1:200 dilution) was used to visualize CTGF-reactive bands, β-tubulin (1:1000 dilution) was used as a loading control for detection of CTGF in total cell lysates. For samples prepared from conditioned media, loading was normalized to the amount of seeded cells (amount of collected cells did not change significantly). Conditioned media were collected, centrifuged at 12,000 rpm for 5 min, and concentrated 5 times using 10K Centricon filters. *, p<0.05 (D) Immunofluorescent staining of cells cultured on 2DCI and 3DCI for 24 h. Rabbit anti-CTGF (H-55) and goat anti-rabbit Alexa488 antibodies used at 1:50 and 1:500 dilutions, respectively. Histogram shows quantitative analysis of CTGF expression in total lysates of cells cultured atop 3DCI and 2DCI; *, p<0.05 (E) Three-dimensional PEG gel culture downregulates CTGF mRNA. Cells were cultured atop 3D 10% PEG, containing 0.3 mM RGD, as well as on 0.3 mM RGD-coated tissue culture plates (2D) for indicated periods of time. Ratios of CTGF mRNA expression on 2D compared to 3D were found with 2-ΔΔCt method. *, **, p<0.05 (F) DOV13 cells were cultured atop 3D collagen III and thin-layer collagen III for 8 hours. Ratio of CTGF expression on 2D vs 3D collagen III is shown by the black bar. Expression of CTGF mRNA in spheroids (hatched bar) was compared to that in cells released from monolayers (single). *, p<0.05 All experiments were performed three times; data represent mean ± standard deviation.
Figure 2
Figure 2. Three-dimensional collagen I culture downregulated CTGF in many cell types
Breast carcinoma MDA-MB231 (A), rat cortical neurons (B), fibrosarcoma HT1080 (C), and HUVEC (D) were cultured atop 3DCI and on thin layer collagen I for indicated periods of time. Real time RT-PCR was performed to evaluate CTGF mRNA expression. Ratio of CTGF mRNA expression on 2DCI versus 3DCI was quantified with 2-ΔΔCt method. Ratio equal to 1 represents no change, greater than 1 denotes an increase, and lower than 1 shows a decrease between the compared conditions. Experiments for each cell type were performed twice, averaged and plotted as mean ± standard deviation, *, p<0.05.
Figure 3
Figure 3. Immunohistochemical analysis of CTGF expression in human normal ovary and EOC
Representative examples of CTGF expression in normal ovarian stroma (A) and primary epithelial serous adenocarcinoma with the intensity of staining 1+ (B), 2+ (C), 3+ (D). Tissues were stained with CTGF specific antibodies as indicated in Methods. Cytoplasmic staining with CTGF antibodies in EOC was detected (CTGF – brown, nuclear DNA – hematoxylin&eosin); magnification = 200×.
Figure 4
Figure 4. CTGF affects ovarian carcinoma collagen adhesion to and invasion of collagen
(A) Cells were allowed to adhere to surfaces coated with CTGF, collagen I, collagen I and CTGF mixture, or BSA for 1 hour as described in Methods. Adherent cells were quantified, averaged, and plotted as a number of adherent cells per field, as indicated. Data represent mean ± standard deviation and are an average of two independent experiments, each performed in triplicate. *, **, p<0.05 (B) Three-dimensional collagen I invasion assay was performed for 18 hours as detailed in Methods with DOV13 cells transfected with control siRNA, CTGF siRNA, plasmid overexpressing CTGF, as indicated. Experiments were performed four times, each in triplicate. *, **, p<0.05 (C) Downregulation of CTGF expression by specific siRNA and overexpression in cells transfected with pCTGF was examined with Western blot. Histogram shows quantitative analysis of CTGF expression. Data are an average of three independent experiments. *, **, p<0.05 (D) Scratch wound assay was performed in monolayers of DOV13 cells transfected with CTGF or control siRNA as indicated. Healing wounds were observed 5 and 24 hours following the wounding and the data depicted as % wound healing. Data are an average of two independent experiments performed in duplicate and shown as mean ± standard deviation. Student’s t-test analysis demonstrated that differences in wound repair are not significant; *, **, p>0.05.
Figure 5
Figure 5. Effect of integrin subunit-specific blocking antibodies on ovarian carcinoma cell adhesion to CTGF
Adhesion to BSA (first bar from the left) or CTGF (0.8 μg; remaining bars) was evaluated as described in Materials and Methods. Adhesion to CTGF in the absence of any antibody (second bar from the left) was arbitrarily set as 100%, and remaining data are reported as a percentage relative to adhesion to CTGF. Total concentration of function blocking antibodies, where applicable, was 10 μg/ml. In the conditions where 2 or 3 different function blocking antibodies were used, individual concentrations were 5 μg/ml and 3.3 μg/ml, respectively. Two different αV-integrins were used, MAB1980 and MAB2021Z, with similar results, however, only the data for MAB2021Z are presented. In experiments containing a mixture of αV-integrin and other integrin function blocking antibodies, MAB1980 was used. Data are presented as mean ± standard deviation. Differences in cell adhesion to CTGF in the presence of function blocking antibodies were statistically significant, as indicated * p < 0.05. Experiments were performed thrice, each in duplicate, quantified, and averaged as detailed in Methods.

References

    1. Jemal A, Siegel R, Ward E, Murray T, Xu J, Smigal C, Thun MJ. Cancer statistics, 2006. CA: a Cancer Journal for Clinicians. 2006;56:106–30. - PubMed
    1. Cannistra SA. Cancer of the ovary. New England Journal of Medicine. 1993;329:1550–9. [see comment][erratum appears in N Engl J Med 1994 Feb 10;330(6):448] - PubMed
    1. Hanahan D, Weinberg RA. The hallmarks of cancer. Cell. 2000;100:57–70. - PubMed
    1. Bissell MJ, Radisky D. Putting tumours in context. Nat Rev Cancer. 2001;1:46–54. - PMC - PubMed
    1. Harvey W, Amlot PL. Collagen production by human mesothelial cells in vitro. J Pathol. 1983;139:337–47. - PubMed

Publication types

MeSH terms