. 2009 Dec;57(16):1706-15.
doi: 10.1002/glia.20882.

Heterogeneity of Kir4.1 channel expression in glia revealed by mouse transgenesis

Affiliations

Heterogeneity of Kir4.1 channel expression in glia revealed by mouse transgenesis

Xiaofang Tang et al. Glia. 2009 Dec.

Abstract

The weakly inwardly rectifying K(+) channel Kir4.1 is found in many glial cells including astrocytes. However, questions remain regarding the relative contribution of Kir4.1 to the resting K(+) conductance of mature astrocytes in situ. We employed a bacterial artificial chromosome transgenic approach in mice to visualize Kir4.1 expression in vivo. These mice (Kir4.1-EGFP) express enhanced green fluorescent protein (EGFP) under the transcriptional control of the Kir4.1 promoter. The brains of adult Kir4.1-EGFP transgenic mice showed co-expression of EGFP and Kir4.1 in astrocytes. In addition, weaker expression of EGFP was detected in NG2+ glial cells when compared with EGFP expression in GFAP+ glial cells. Whole-cell voltage clamp recordings of EGFP+ glial cells in the CA1 area of the adult mouse hippocampus indicated astrocytes displaying properties consistent with both the "passive" and "complex" subpopulations. EGFP+ cells with bright fluorescence had the linear current-voltage (I-V) relationships and extensive gap junctional coupling characteristic of passive astrocytes. However, EGFP+ glia with weaker fluorescence displayed properties associated with complex astrocytes including nonlinear I-V relationships and lack of intercellular gap junctional coupling. Pharmacological blockade of inward currents implied that Kir4.1 channels constitute the dominant resting K(+) conductance in both glial cell types and are more highly expressed in passive astrocytes. These results suggest differential expression of Kir4.1 in glia and that this channel likely underlies the resting K(+) conductance in passive and complex astrocytes.


Figures
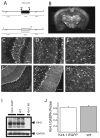
Figure 1
Figure 1. Generation and initial characterization of Kir4.1-EGFP mouse line
(A) Schematic representation of the transgene Kir4.1-EGFP. The 185 kb mouse genomic bacterial artificial chromosome (BAC) clone RP23 – 157J4 containing the entire transcriptional unit of Kir4.1 together with 132 kb upstream and 52 kb downstream was engineered to harbor EGFP coding sequences followed by a polyadenylation signal (pA) into the coding region of Kir4.1 gene by homologous recombination in E. coli. (B) Intrinsic EGFP signal in coronal section of Kir4.1-EGFP mouse brain. (C–H) Intrinsic EGFP signals of Kir4.1-EGFP mouse brain in dentate gyrus of hippocampus (C), area CA1 of hippocampus (D), cortex (E), cerebellum (F-G), and olfactory bulb (H). (I–J) Western blot analyses of Kir4.1 channel expression in Kir4.1-EGFP and wild-type mouse brains. Arrows indicate the bands corresponding to Kir4.1 and glyceraldehyde-3-phosphate dehydrogenase (GAPDH). Kir4.1 knockout (KO) mouse brain was used as a control for the specificity of anti-Kir4.1 antibody used (I). Similar levels of Kir4.1 channel expression was verified using densitometric analyzes (n=5)(J). Scale bars: 1 mm (B), 50 μm (C,D,E,G,H) 100 μm (F).
Figure 2
Figure 2. EGFP is not expressed in neurons and co-localizes with Kir4.1 in brain
(A–C) Immunostaining for EGFP and NeuN in the Kir4.1-EGFP cortex. Notice the expression of EGFP (arrows) in small cell bodies and lack of expression in NeuN+ cells (arrowheads). (D–I) Immunostaining for EGFP and Kir4.1 in area CA1 of the hippocampus (D–F) and cortex (G–I). Small squares are shown enlarged in insets in the lower left corners of each panel. Arrowheads indicate EGFP-positive cells that clearly show Kir4.1 expression in the soma. Scale bars: 50 μm (A,D,G).
Figure 3
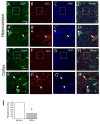
Figure 3. Kir4.1 is highly expressed in GFAP+ glia and weakly expressed in NG2+ glia in the gray matter of Kir4.1-EGFP mouse brain
(A–H) Triple labeling of brain sections for Enhanced green fluorescent protein (EGFP), chondroitin sulfate proteoglycan NG2 (NG2) and Glial fibrillary acidic protein (GFAP). Areas in the small squares are enlarged in corresponding lower figures. Arrowheads indicate GFAP+ cells while arrows indicate NG2+ cells. (I) The EGFP signal for the soma of cells identified as either GFAP+ (n = 264) or NG2+ (n = 103) was quantified and shown as fluorescence intensity in arbitrary units, * P< 0.05. Scale bars: 50 μm (A, E).
Figure 4
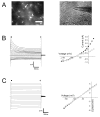
Figure 4. Weakly and brightly fluorescent glia in CA1 of hippocampus display distinct functional properties
(A) Left panel shows epifluorescence image of weakly (arrow) and brightly (arrowhead) fluorescent glia. DIC image in the right panel shows the recording pipette in the weakly fluorescent cell shown in the left panel magnification. (B,C) Currents elicited and I-V relationship upon voltage steps from −160 to +30 mV in weakly (B) and brightly (C) fluorescent cells at the beginning (●) and the end of the pulse (○). Scale bar: 50 μm (A).
Figure 5
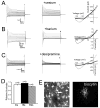
Figure 5. Pharmacological blockade of evoked currents in weakly fluorescent glia
(A–C) Current traces and I-V relationships in the absence (○) and presence (●) of 1 mM cesium (A), 100μM barium (B) or 100 μM desipramine (C) in the bath. (D) Summary of the relative blockade at −140 mV for cesium (Cs), barium (Ba) or desipramine (Des). (E) Confocal reconstruction of a recorded weakly fluorescent glial cell filled with biocytin (arrow). Scale bar = 50 μm.
Figure 6
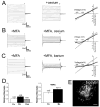
Figure 6. Pharmacological blockade of currents evoked in brightly fluorescent glia
(A) Current traces and I-V relationships in the absence (○) and presence (●) of 1 mM cesium. (B, C) Current traces and I-V relationships in the absence (○) and presence (●) of 1 mM cesium (B) or 100 μM barium (C) plus 100 μM meclofenamic acid (MFA). (D) Summary of the relative current blockade at −140 mV for cesium (Cs), barium (Ba) or desipramine (Des) in presence or absence of MFA. (E) Confocal reconstruction of a recorded brightly fluorescent cell (arrow) filled with biocytin. Notice the spread of the tracer biocytin to neighboring cells. Scale bar = 50 μm.

Similar articles

Cited by

References

    1. Barbarese E, Carson JH, Braun PE. Accumulation of four myelin basic proteins in mouse during development. J Neurochem. 1978:779–782. - PubMed
    1. Connors NC, Adams ME, Froehner SC, Kofuji P. The potassium channel Kir4.1 associates with the dystrophin glycoprotein complex via alpha-syntrophin in glia. J Biol Chem. 2004;279:28387–92. - PubMed
    1. D’Ambrosio R, Wenzel J, Schwartzkroin P, McKhann GI, Janigro D. Functional specialization and topographic segregation of hippocampal astrocytes. J Neurosci. 1998;18:4425–38. - PMC - PubMed
    1. Djukic B, Casper KB, Philpot BD, Chin LS, McCarthy KD. Conditional knock-out of Kir4.1 leads to glial membrane depolarization, inhibition of potassium and glutamate uptake, and enhanced short-term synaptic potentiation. J Neurosci. 2007;27:11354–65. - PMC - PubMed
    1. Doupnik CA, Davidson N, Lester HA. The inward rectifier potassium channel family. Curr Opin Neurobiol. 1995;5:268–77. - PubMed

Publication types

MeSH terms