

Review
Creation of functional micro/nano systems through top-down and bottom-up approaches
Affiliations
- PMID: 19382535
- PMCID: PMC2778060
Item in Clipboard
Review
Creation of functional micro/nano systems through top-down and bottom-up approaches
Mol Cell Biomech.
2009 Mar.
Abstract
Mimicking nature's approach in creating devices with similar functional complexity is one of the ultimate goals of scientists and engineers. The remarkable elegance of these naturally evolved structures originates from bottom-up self-assembly processes. The seamless integration of top-down fabrication and bottom-up synthesis is the challenge for achieving intricate artificial systems. In this paper, technologies necessary for guided bottom-up assembly such as molecular manipulation, molecular binding, and the self assembling of molecules will be reviewed. In addition, the current progress of synthesizing mechanical devices through top-down and bottom-up approaches will be discussed.
Figures

A radiolarian micro-skeleton with single porous shell and large centrally organized radial spines. (Reprinted with permission from Oxford University Press and courtesy of Prof. Stephen Mann, University of Bristol, UK)

Sectioning of the skeleton of Euplectella sp showing the structural hierarchy from nanoscale (I) to macroscale domain (A–B). Scale bar, A: 1cm, B: 5mm, C: 100µm, D:20µm, E:25µm, F:10µm, G:5µm, H:1µm, I:500nm. (Reprinted with permission from Aizenberg et al., Science, 2005, 309: 275–278, Copyright 2005, AAAS)

Cell movement is originated from the spatially and temporally controlled assembly and disassembly of molecular proteins. (Top left) Overlays of phase contrast micrographs (in 15 sec intervals) showing the motility of a keratocyte and a keratocyte cytoplast. (Top middle) Fluorescently labeled actin filaments and (Top right and bottom) the corresponding electron micrographs (Reprinted with permission from Pollard and Borisy, Cell, 2003, 112:453–465, copyright 2003, Elsevier)

Conceptual representation of intermolecular interactions involved in a guided self-assembled system utilizing top-down and bottom-up fabrication schemes

The formation of aragonite and calcite crystals induced by protein macromolecules. (A and B) Aragonite induced by the soluble glycoproteins extracted from the aragonitic layer of the shell of Elliptio sp. (C and D) Calcite induced from the soluble glycoproteins extracted from the calcitic shell of M. californianus. (Reprinted with permission from Falini et al., Science, 1996, 271: 67–69 Copyright 1996, AAAS)

Pattern formation by nanoscale self-assembly of DNA. Scale bar, 100nm. (Reprinted by permission from Macmillian Publishers Ltd: P.W.K. Rothermund, Nature, 2006, 440: 297–302, copyright 2006)

A DNA nanomechanical rotary device based on B-form and Z-form DNA conformational changes. (Reprinted by permission from Macmillian Publishers Ltd: Mao et al., Nature, 1999, 397:144–146, copyright 1999)

Fluorescent image sequences showing the spatial distribution of chromosomes (shown in blue) and microtubules (shown in green) at 4 different stages of the mitosis process (from A – D). Scale bar, 20µm. (Reproduced by permission from The Journal of Cell Biology, 1993, 122: 361 – 372. Copyright 1993 The Rockefeller University Press)

Electron micrograph showing the branching structures formed by Arp2/3 and F-actin. (A) Arp2/3 complex. (B) F-actin forms branched structures with the presence of Arp2/3. (C) The side-branching structures are at 70° with respect to the main F-actin. (Reproduced from Proceedings of National Academy of Sciences, USA, 1998, 95: 6181 – 6186. Copyright 1998 The National Academy of Sciences, USA)

Electron micrograph showing the structure of myosin V bound to an actin filament. (Lower panel) Myosin V spans a distance of 13 actin subunits. (Reprinted by permission from Macmillian Publishers Ltd: Walker et al., Nature, 2000, 405: 804–807, copyright 2000)

Concepts of selected lithography technologies

Synthesis of KCl nanocrystals on predetermined locations through wetting/dewetting of droplets on electron beam lithography defined patterns (196)

Control of crystallographic orientation of CaCO3 crystals by using a self-assembled monolayer at pre-determined locations of a surface (Reprinted by permission from Macmillian Publishers Ltd: Aizenberg et al., Nature, 1999, 398: 495–498, copyright 1999)

DNA patterning through soft lithography and molecular combing. Scale bar, 25µm. (Reprinted by permission from Wiley InterScience: Björk et al., Small, 2006, 2:1068–1074, copyright 2006)

2D protein patterning through optical lithography. (A) Process flow showing the surface functional groups activation by deep UV light and the subsequent protein attachment. (B) Red fluorescent streptavidin was patterned to locations of UV exposure after incubation of a biotinylated aldehyde reactive probe. Scale bar, 25µm. (Reprinted by permission from American Chemical Society: K.L. Christman & H.D. Maynard, Langmuir, 2005, 21:8389–8393, copyright 2005)

Optical fluorescence image showing the surface-initiated growth of F-actin from electron beam lithography defined nanoscale patterns (i.e., concentric circles). Inset showing a SEM image of a free-standing surface-initiated growth of single F-actin. Scale bar, 500nm (229, 230)

Diffusion limited patterning inside nanofluidic channels. (A) Schematic showing the concept of DLP. (B) DLP with unlabeled and fluorescently labeled streptavidin. Channel design, concentrations of the streptavidin and time durations for each step are as follows: (a) channel design I, 1mg/ml, 5 min (b) channel design II, 1mg/ml, 2 min, (c) channel design I, 100µg/ml, 10min, (d) channel design II, 100µg/ml, 10min. Scale bar, 20µm. (Reprinted by permission from American Chemical Society: Karnik et al., Nano Lett., 2006, 6: 1735–1740, copyright 2006)

Capillary electrophoretic movement of fluorescently-tagged DNA molecules inside a microfluidic channel
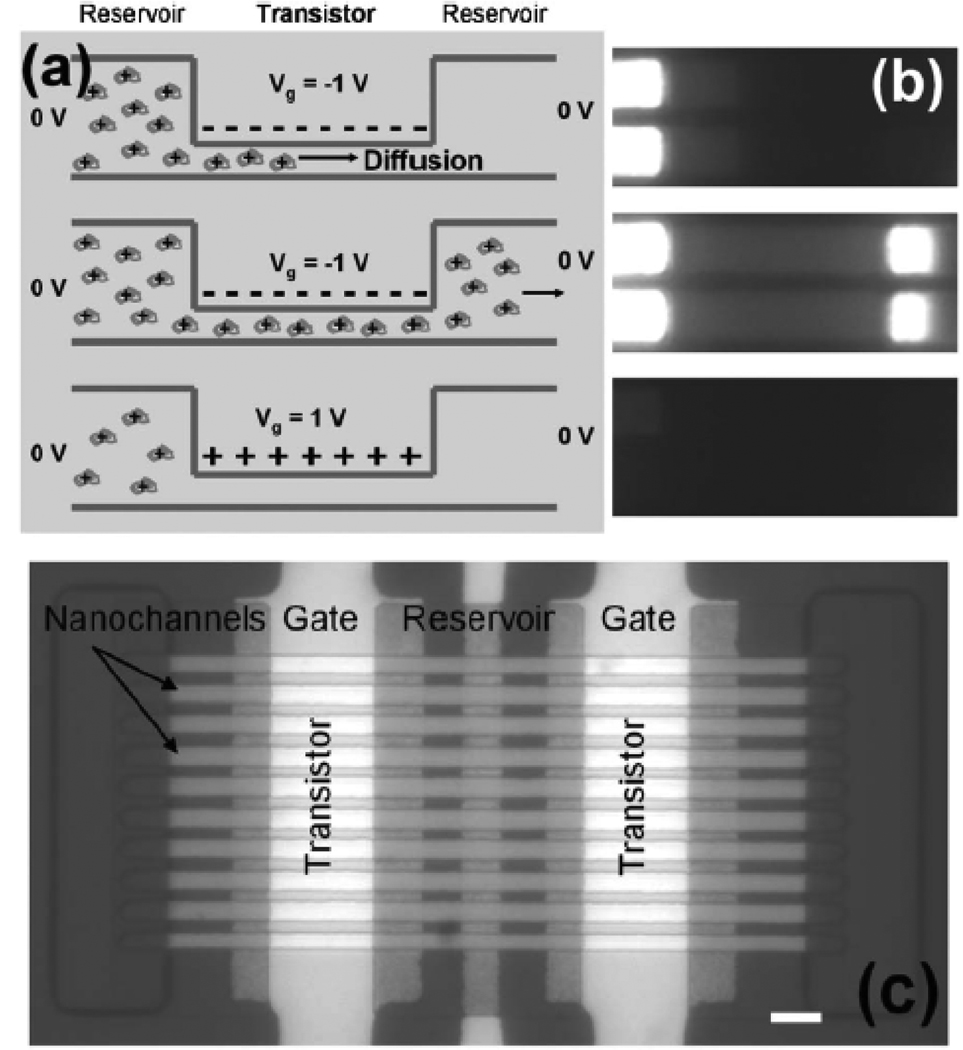
A nanofluidic transistor for molecular transport. (a) Schematic showing the diffusion of the avidin when the transistor is switched on without bias between the microchannels. (b) Fluorescence images corresponding to (a). (c) Micrograph of a nanofluidic transistor. Scale bar, 10µm. (Reprinted with permission from Karnik et al., Appl. Phy. Lett., 2006, 88:123114, Copyright 2006, American Institute of Physics)

Particle manipulation and transportation by optoelectronic tweezers (OET). (Reprinted by permission from Macmillian Publishers Ltd: Chiou et al., Nature, 2005, 436: 370–372, copyright 2005)

AC electroosmotic focusing of biomolecules. (A) Design of the electrodes. (B) Schematic showing the formation of AC electroosmotic flow. (C) Time sequence images (in 10s interval, a–f) showing the concentration of 200nm fluorescence particles on the central electrode. (Reprinted by permission from American Chemical Society: Wong et al., Anal. Chem., 2004, 76: 6908–6914, copyright 2004)

Manipulation of DNA by the inter-cooperative motion of microtubules and the kinesin. (Reprinted by permission from American Chemical Society: Diez et al., Nano Lett. 2003, 3:1251–1254, copyright 2003)

Sequences of images (in 10s interval) showing the transportation of a micromachined S structure with microtubule-kinesin system. (Reprinted with permission from Yokokawa et al., JMEMS, 2004, 13: 612–619, Copyright 2004, IEEE)

Actuation of micro-cantilever beams by synthetic molecular linear motors. (A) Conceptual representation showing the actuation mechanism. (B) Reversible bending of four micro-cantilever beams actuated by synthetic molecular linear motors. (Reprinted with permission from Huang et al., Appl. Phy. Lett., 2004, 85:5391 – 5393, Copyright 2004, American Institute of Physics)

MEMS actuator powered by self-assembled muscle. (A) Before muscle contraction. (B) During muscle contraction. (C) After relaxation of the muscle. Scale bar, 100µm (Reprinted by permission from Macmillian Publishers Ltd: J. Xi et al., Nat. Mater., 2005, 4:180–184, copyright 2005)
References
-
- Horne RW, Wildy P. Virology. 1961;15:348–373. - PubMed
-
- Aizenberg J, Tkachenko A, Weiner S, Addadi L, Hendler G. Nature. 2001;412:819–822. - PubMed
-
- McMahon TA, Bonner JT. On size and life. New York: Scientific American Library : Distributed by W.H. Freeman; 1983.
-
- Mann S. Biomineralization : principles and concepts in bioinorganic materials chemistry. New York: University Press, Oxford; 2001.
-
- Mann S. Journal of the Chemical Society-Dalton Transactions. 1997:3953–3961.
Publication types
MeSH terms
Substances
Grants and funding
LinkOut - more resources
Full Text Sources