. 2009 Nov;15(11):3283-95.
doi: 10.1089/ten.TEA.2009.0081.

Multiple channel bridges for spinal cord injury: cellular characterization of host response

Affiliations

Multiple channel bridges for spinal cord injury: cellular characterization of host response

Yang Yang et al. Tissue Eng Part A. 2009 Nov.

Abstract

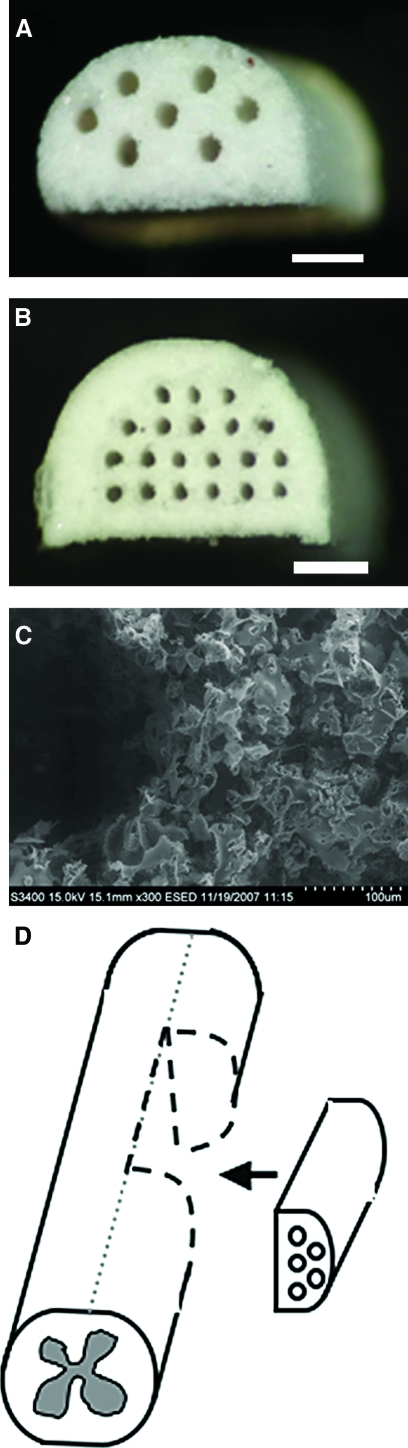
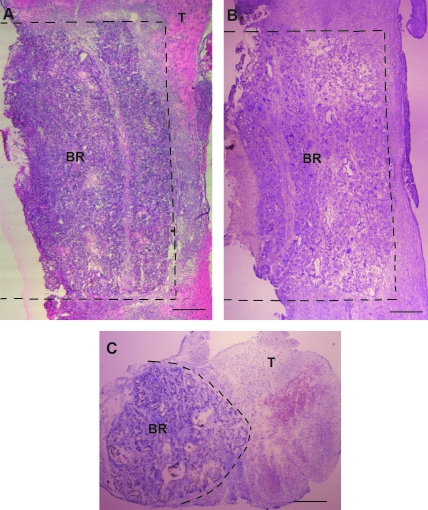
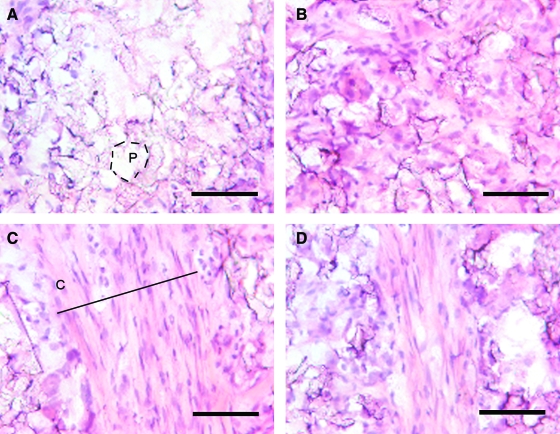
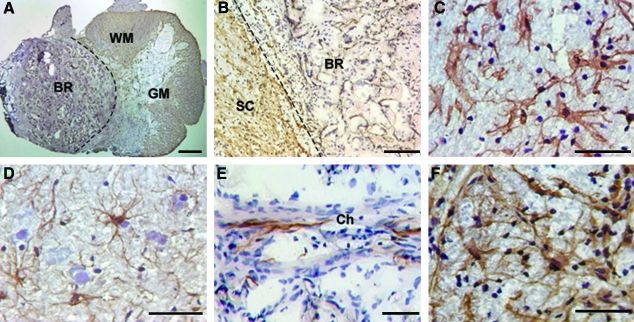
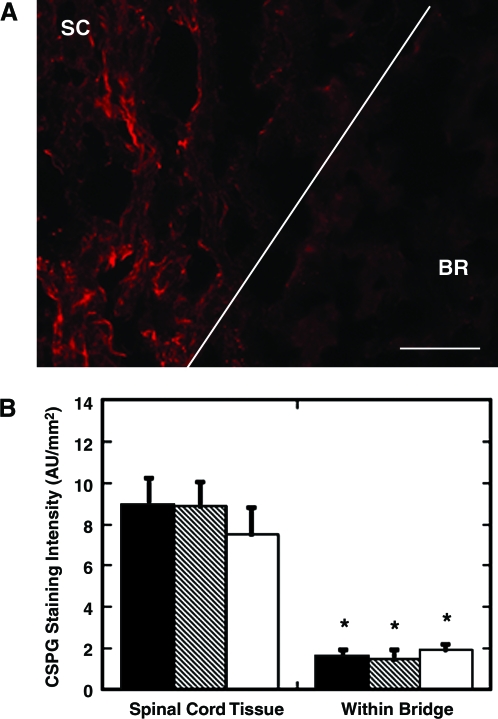
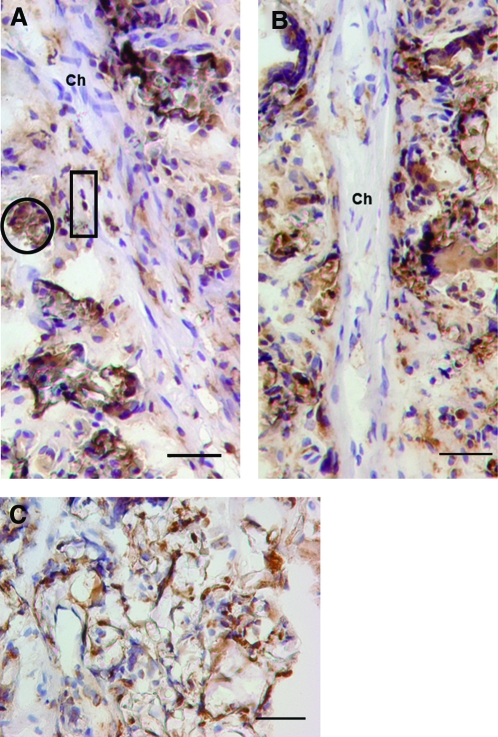
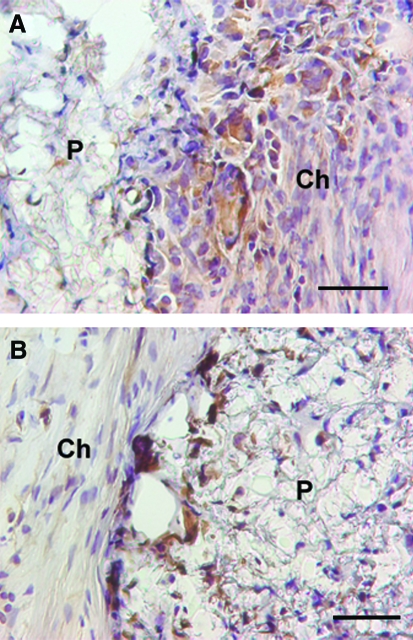
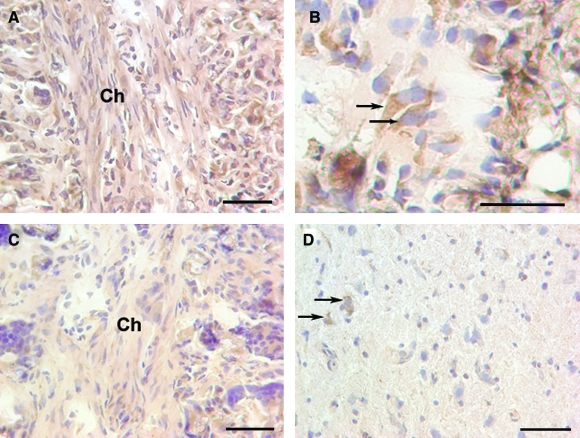
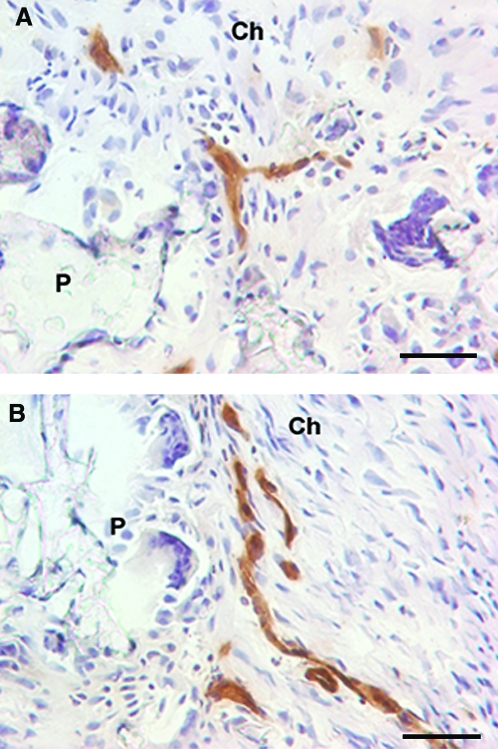
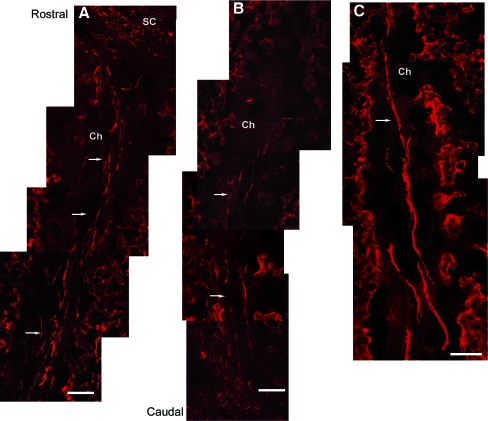
Bridges for treatment of the injured spinal cord must stabilize the injury site to prevent secondary damage and create a permissive environment that promotes regeneration. The host response to the bridge is central to creating a permissive environment, as the cell types that respond to the injury have the potential to secrete both stimulatory and inhibitory factors. We investigated multiple channel bridges for spinal cord regeneration and correlated the bridge structure to cell infiltration and axonal elongation. Poly(lactide-co-glycolide) bridges were fabricated by a gas foaming/particulate leaching process. Channels within the bridge had diameters of 150 or 250 microm, and the main body of the bridge was highly porous with a controllable pore size. Upon implantation in a rat spinal cord hemisection site, cells infiltrated into the bridge pores and channels, with the pore size influencing the rate of infiltration. The pores had significant cell infiltration, including fibroblasts, macrophages, S-100beta-positive cells, and endothelial cells. The channels of the bridge were completely infiltrated with cells, which had aligned axially, and consisted primarily of fibroblasts, S-100beta-positive cells, and endothelial cells. Reactive astrocytes were observed primarily outside of the bridge, and staining for chondroitin sulfate proteoglycans was decreased in the region surrounding the bridge relative to studies without bridges. Neurofilament staining revealed a preferential growth of the neural fibers within the bridge channels relative to the pores. Multiple channel bridges capable of supporting cellular infiltration, creating a permissive environment, and directing the growth of neural fibers have potential for promoting and directing spinal cord regeneration.


Figures

FIG. 1.
FIG. 1.
Images of multiple channel bridges with 250 μm channels (A) and 150 μm channels (B). Scanning electron microscopy photomicrograph of the bridge fabricated with 250 μm channels and 63–106 μm porogen (C). Schematic of rat spinal cord hemisection model (D). Scale bar represents 500 μm (A, B) or 100 μm (C). Color images available online at www.liebertonline.com/ten.
FIG. 2.
FIG. 2.
Bridge retained apposition with surrounding spinal cord. Bridge had channel diameter of 250 μm and small porogens that were retrieved at 2 weeks (A, C) and 6 weeks (B). Panels (A) and (B) are longitudinal sections, and panel (C) is a transverse section that indicates the relative position of the bridge within the spinal cord. The dashed line indicates the host tissue/bridge interface. Tissue sections (10 μm) were stained with hematoxylin and eosin and imaged under light microscopy. BR indicates bridge, and T indicates spinal cord tissue. Scale bar represents 500 μm. Color images available online at www.liebertonline.com/ten.
FIG. 3.
FIG. 3.
Cellular ingrowth and alignment within bridges. Images of bridge pores of <38 μm porogen bridges (A) and 63–106 μm porogen bridges (B). Bridge channels were 250 μm diameter (C) and 150 μm diameter (D). Implants were retrieved at 2 weeks, and tissue sections (10 μm) were stained with hematoxylin and eosin and imaged under light microscopy. Scale bar represents 100 μm. The letter P indicates a pore within the bridge and C represents a channel. Color images available online at www.liebertonline.com/ten.
FIG. 4.
FIG. 4.
Astrocyte distribution within the bridge. Tissue sections stained with glial fibrillary acidic protein-positive cells postimplantation. Note that the brown color indicates positive staining. Images were captured for a transverse section (A) or in a longitudinal section at the bridge/tissue interface (B), the tissue immediately surrounding the bridge (C), or tissue rostral to the bridge and far from the implant (D). Images were also captured for the channels (E) of the bridge. (F) Glial fibrillary acidic protein staining for the negative control, which consisted of a lateral hemisection without bridge implantation. Sections were obtained at 2 weeks (A–D, F) or 6 weeks (E) postimplantation. BR indicates bridge, SC indicates spinal cord tissue, Ch indicates channel within the bridge, GM indicates gray matter, and WM indicates white matter of the spinal cord. For panel (A) scale bar is 100 μm, whereas for panels (B–E) scale bar is 50 μm. Color images available online at www.liebertonline.com/ten.
FIG. 5.
FIG. 5.
Chondroitin sulfate proteoglycan (CSPG) staining. (A) CSPG staining for a bridge (250 μm channels, small porogen) after 2 weeks of implantation. (B) Quantification of CSPG at the injury site demonstrated a dramatic reduction of CSPG intensity within the bridge relative to the spinal cord tissue that was immediately adjacent to the bridge. The three bridge conditions are (i) small porogen, 250 μm channel (black bars), (ii) large porogen, 250 μm channel (gray bars), and (iii) small porogen, 150 μm channel (white bars). Asterisk indicates statistical significance with p < 0.01. BR indicates bridge, and SC indicates spinal cord tissue. Scale bar represents 100 μm. Color images available online at www.liebertonline.com/ten.
FIG. 6.
FIG. 6.
Macrophage. ED-1 staining of tissue sections retrieved 2 weeks (A) or 6 weeks (B, C) after implantation. Within the pores, the macrophages appeared large (circle), whereas in the channels, they were small and aligned (box). Note that the brown color indicates positive staining. The bridge condition was 250 μm and large porogen. Ch indicates channel within the bridge. Scale bar represents 50 μm. Color images available online at www.liebertonline.com/ten.
FIG. 7.
FIG. 7.
Schwann and glial cells. S-100β staining of tissue sections retrieved 2 weeks (A) or 6 weeks (B) after implantation. Note that the brown color indicates positive staining. The bridge condition was 250 μm and large porogen. Ch indicates channel within the bridge, and P indicates pores of the bridge. Scale bar represents 50 μm. Color images available online at www.liebertonline.com/ten.
FIG. 8.
FIG. 8.
Fibroblasts. rPH staining of tissue sections retrieved 2 weeks (A, B) or 6 weeks (C, D) after implantation. Images were captured of the bridge channels (A–C). Panel (B) presents a higher magnification image to demonstrate staining specificity, with two positively stained cells indicated by arrows. Tissue caudal to the bridge served as a control for nonspecific staining, in which little staining was observed (arrows) (D). Note that the brown color indicates positive staining. The bridge condition was 250 μm and large porogen. Ch indicates a channel in the bridge. The scale bar represents 50 μm. Color images available online at www.liebertonline.com/ten.
FIG. 9.
FIG. 9.
Endothelial cells. Rat endothelial cell antigen-1 staining of tissue sections retrieved 2 weeks (A) or 6 weeks (B) after implantation. Note that the brown color indicates positive staining. The bridge condition was 250 μm and large porogen. Ch and P indicate the channel and pores of the bridge, respectively. Scale bar represents 50 μm. Color images available online at www.liebertonline.com/ten.
FIG. 10.
FIG. 10.
Neurofilament staining. Neurofilament staining within channels from bridge conditions: 150 μm channels and small (<38 μm) porogen. White arrows indicate examples of positive neurofilament staining (red). Images were captured at the rostral (A) and caudal (B) bridge/tissue interface at 2 weeks. (C) Image captured in the middle of the bridge from an implant removed at 6 weeks. Ch indicates channel, and SC indicates spinal cord tissue. Scale bar represents 50 μm. Color images available online at www.liebertonline.com/ten.
FIG. 11.
FIG. 11.
Basso, Beattie, Bresnahan (BBB) scores for animals implanted with bridges (250 μm, small porogen) in a lateral hemisection. The lines represent the left (injured) and right (uninjured) side.

Similar articles

Cited by

References

    1. Dusart I. Schwab M.E. Secondary cell death and the inflammatory reaction after dorsal hemisection of the rat spinal cord. Eur J Neurosci. 1994;6:712. - PubMed
    1. David S. Aguayo A.J. Axonal elongation into peripheral nervous system “bridges” after central nervous system injury in adult rats. Science. 1981;214:931. - PubMed
    1. Stichel C.C. Muller H.W. Experimental strategies to promote axonal regeneration after traumatic central nervous system injury. Prog Neurobiol. 1998;56:119. - PubMed
    1. Schmidt C.E. Leach J.B. Neural tissue engineering: strategies for repair and regeneration. Annu Rev Biomed Eng. 2003;5:293. - PubMed
    1. Bunge M.B. Bridging areas of injury in the spinal cord. Neuroscientist. 2001;7:325. - PubMed

Publication types

Substances