Comparative Study
. 2007 Sep;1(2):181-95.
doi: 10.1016/j.molonc.2007.05.005. Epub 2007 Jun 3.

Phosphoprotein Keratin 23 accumulates in MSS but not MSI colon cancers in vivo and impacts viability and proliferation in vitro

Affiliations
Comparative Study

Phosphoprotein Keratin 23 accumulates in MSS but not MSI colon cancers in vivo and impacts viability and proliferation in vitro

Karin Birkenkamp-Demtroder et al. Mol Oncol. 2007 Sep.

Abstract

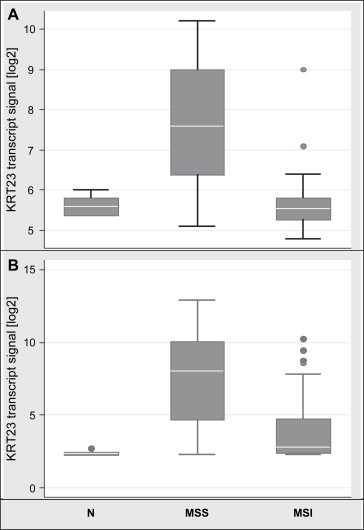
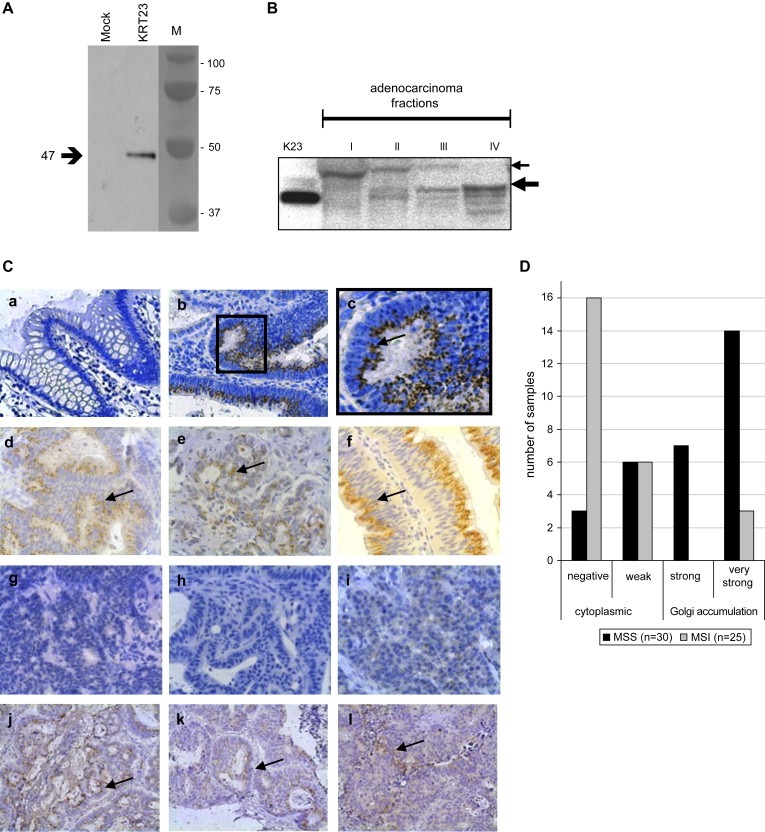
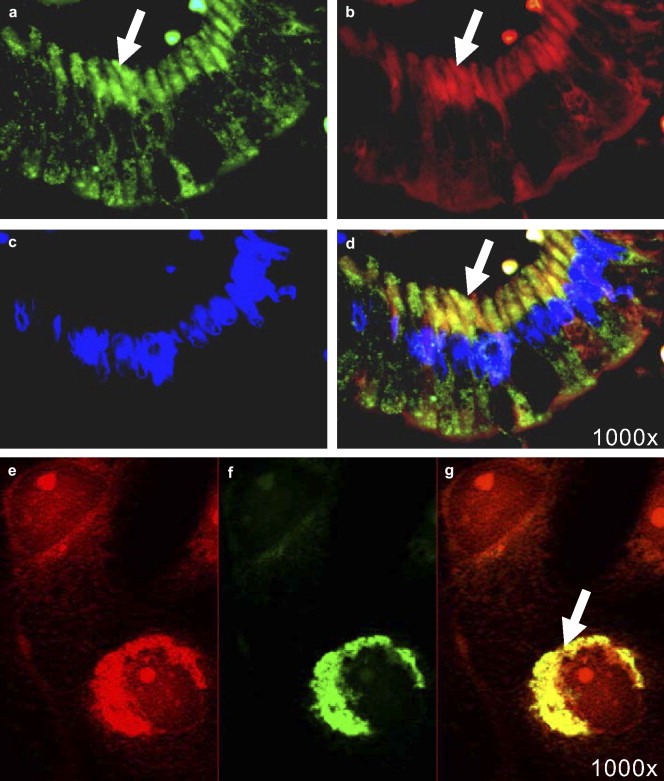
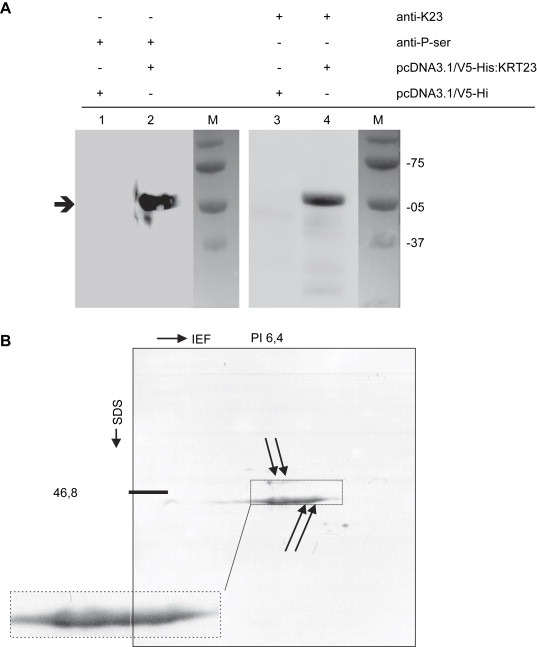
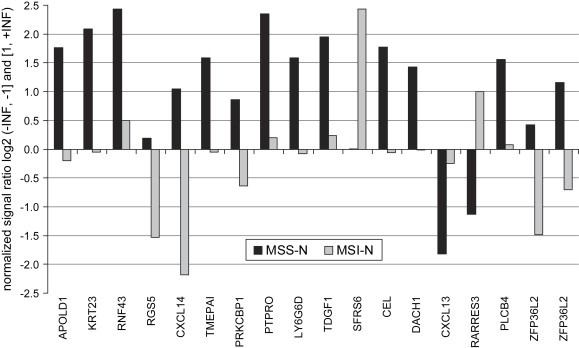
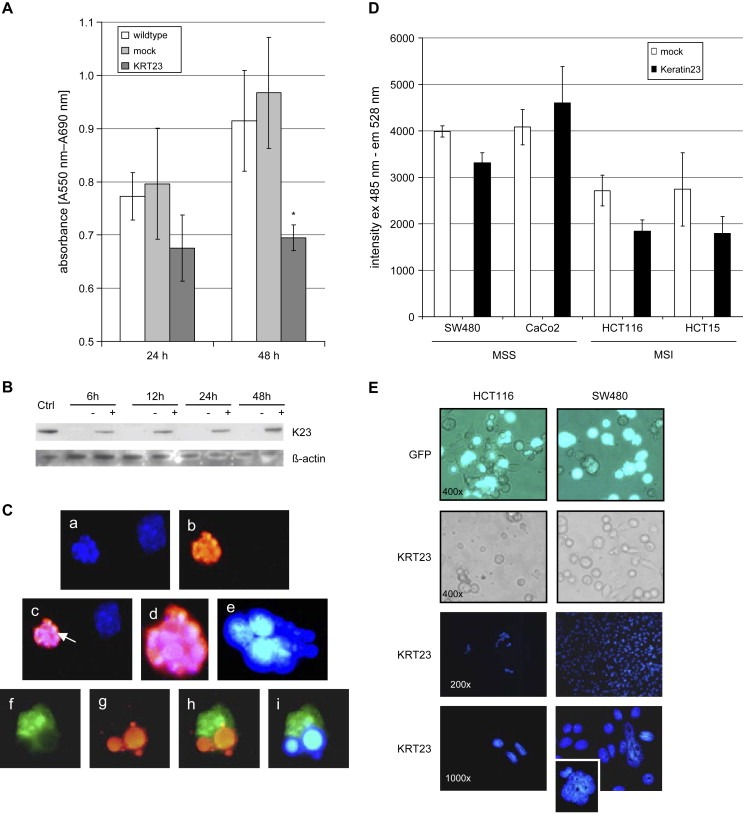
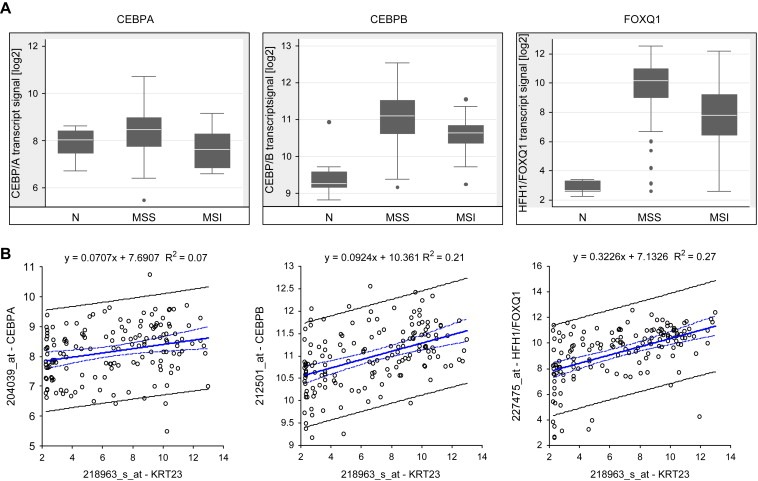
Transcript profiling of 27 normal colon mucosas and 258 adenocarcinomas showed Keratin23 to be increased in 78% microsatellite-stable tumors, while microsatellite-instable tumors showed low transcript levels, comparable to normal mucosas. Immunohistochemical analyses demonstrated that 88% of microsatellite-instable tumors were negative for Keratin23 protein, while 70% of MSS tumors and metastases derived from MSS-tumors showed high Keratin23 levels. Immunofluorescence analysis localized Keratin23 in the Golgi-apparatus. Golgi accumulation was unique for gastrointestinal adenocarcinomas. Immunoprecipitation and 2D-blot analysis revealed Keratin23 to be a 46.8 kDa phosphoprotein. Keratin23 impaired the proliferation of human colon cancer cells significantly, leading to cell death in microsatellite-instable but not microsatellite-stable cell lines, while COS7 cells experienced multiple nuclei and apoptosis. Keratin23 expression correlated significantly with transcription factor CEBPB. In conclusion, Keratin23 expression is a novel and important difference between microsatellite-stable and microsatellite-instable colon cancers.


Figures

Figure 1
Figure 1
Microarray transcript profiling using different platforms showed a significant strong upregulation of KRT23 in MSS adenocarcinomas while expression in MSI tumors was comparable to normal colon mucosa. Box‐whisker plot with normalized data given as log2 values. (A) KRT23 transcripts from U133A2.0 arrays (n=122); Normal n=17, mean 5.635, SD=0.197, median 5.6, 95% CI 5.53–5.73; MSS: n=67, mean 7.724, SD 1.443, median 7.6, 95% CI 7.37–8.07; MSI, n=38, mean 5.702, SD 0.696, median 5.55, 95% CI 5.47–5.93; N vs MSS p=4.8E‐18; MSS vs MSI p=4.1E‐16; N vs MSI p=0.639; (B) KRT23 transcripts from U133plus arrays (n=163); Normal n=10, mean 2.41, SD=0.16, median 2.35, 95% CI 2.29–2.52 MSS: n=118, mean 7.47, SD 3.12, median 8.05, 95% CI 6.89–8.03; MSI, n=35, mean 4.02, SD 2.37, median 2.8, 95% CI 3.20–4.83; N vs MSS p=9.8E‐35; MSS vs MSI p=1.1E‐09; N vs MSI p=0.0003.
Figure 2
Figure 2
Characterization and cellular localization of the K23 protein. (A) Incubation of 5μg of protein extracts from COS7 cells transfected with pCR3.1 (mock) or pCR 3.1:KRT23 (KRT23) with a 1:1000 dilution of the rabbit anti‐K23 antibody identified a single band of approximately 47kDa. (B) Subcellular proteomic fractions from a colon adenocarcinoma were incubated with a 1:500 dilution of the anti‐K23 antibody: (I) cytosolic fraction; (II) membrane/organelle protein fraction; (III) nucleic protein fraction including cellular membranes attached to the nucleus; and (IV) cytoskeletal fraction. (Ctrl) K23. Two main distinct bands of approximately 47kDa and 55kDa are detectable. The 55kDa band was always detected in the cytosolic fraction but never in the cytoskeletal fraction, while the 47kDa band was always strongest in the cytoskeletal fraction but never visible in the cytosolic fraction. (C) Immunohistochemical analyses were performed applying the rabbit anti‐K23 antibody in a 1:600 dilution to FFPE specimens of normal colon mucosas, colon adenocarcinomas and metastases (200× magnification). (a–c) K23 is strongly upregulated in tumor cells of colon adenocarcinomas compared to normal mucosa. (a) Normal mucosa from the resection edge; (b) Dukes C grade 2 adenocarcinoma from the proximal colon; and (c) 400× magnification of (b) showing K23 accumulation at a single site adjacent to the nucleus, probably the GA. (d–i) Analysis of a subset of 55 colon adenocarcinomas previously analyzed on U133A2.0 arrays, comprising 30 tumors with MSS and 25 with MSI status. (d–f) K23 was highly expressed in MSS tumors showing supranuclear accumulation. (g–i) MSI tumors show no or very weak K23 expression in the cytoplasm, probably in cytoplasmic vesicles. (j–l) The primary adenocarcinoma (j), a lymph node metastasis (k) and a liver metastasis (l) obtained successively from the same patient, show strong accumulation of K23 near the nucleus. (D) Scoring results from immunohistochemical analysis of K23 expression in 55 colon adenocarcinomas previously analyzed on microarrays (U133A2.0). The staining intensity of K23 in 30 tumors with MSS status (black) was compared to 25 tumors with MSI status (grey). Strong to very strong K23 accumulation expression accompanied by accumulation of the protein in the Golgi was seen in the majority of MSS tumors.
Figure 3
Figure 3
Immunofluorescence microscopy on tissues and cells. Co‐localization studies were performed using the polyclonal rabbit anti‐K23 antibody in a 1:600 dilution, the mouse monoclonal anti‐58K antibody (1000x magnification). (a–d) 4 μm section of a FFPE colon adenocarcinoma; (Zeiss Axiovision). (e–g) COS7 cells transfected with pCR3.1:KRT23 overexpressing K23; (Zeiss Axiovert200M with Apotome). Green: K23 (a,e), red: Golgi marker 58K (b,e), blue: DAPI nuclear stain (c), yellow: co‐localization of K23 and 58K in the Golgi (d,g); (d) merge of (a) with (b) and (c); (g) merge of (e) with (f).
Figure 4
Figure 4
K23 is a serine phosphorylated protein. (A) Immunoprecipitation of the His‐tagged K23 protein. COS7 cells were transfected with pCR3.1/V5‐His:KRT23, or an empty vector. The anti‐phosphoserine antibody (anti‐P‐ser) detects a 53kDa band (lane 2) indicating a phosphorylation of one or more serines in K23. In a control experiment, the 53kDa His‐tagged K23 is also identified with the rabbit polyclonal anti‐K23 antibody (lane 4). The His‐tagged K23 protein has a molecular weight of about 53kDa compared to 47kDa wild‐type K23. (B) 2D gel electrophoresis and Western blot analysis of the recombinant K23 protein using the anti‐K23 antibody in a 1:1000 dilution determined a pI of 6.4 and a molecular mass of 46.8kDa.
Figure 5
Figure 5
Genes characterizing subgroups of colon adenocarcinomas. Top 17 genes (18 probe sets) differentially expressed in “MSS tumors with high K23” compared to “MSI tumors with low/no Keratin 23” were accessed by immunohistochemistry followed by supervised clustering of transcript profiling data. Ratios are based on median values and are given as normalized ratio log2 (−INF, −1] and [1, +INF).
Figure 6
Figure 6
Expression of K23 impairs proliferation and induces apoptosis. (A) The viability of 4000 COS7 cells was measured at 24h or 48h post‐transfection using an MTT assay. K23 expressing cells showed a significant lower viability compared to wild‐type or mock cells (p=0.01). (B) Western blot of COS7 cell extracts 6, 12, 24 and 48h post‐transfection with pCR3.1:KRT23 (+) or an empty vector (−) incubated with anti K23 antibody or beta‐actin as loading control. Positive with K23. (C) 48h after transfection of COS7 with pCR3.1:KRT23, TUNEL labeling was performed to identify apoptotic cells (1000× magnification). (a) Blue: DAPI nuclear stain, (b) red: TMR stained, fragmented apoptotic nucleus, (c) merge of (a) and (b), showing an apoptotic (arrow) and a non‐apoptotic cell, (d) magnification of (c); (e) multinucleated cell; (f–i) co‐localization of K23 expression in apoptotic cells (1000× magnification): (f) green: anti‐K23 polyclonal antibody, (g) red: TMR stained, fragmented apoptotic nucleus (h) merge of (f) and (g), showing evidence for apoptosis in the K23 overexpressing cell; (i) merge of anti‐K23 polyclonal antibody (green) and DAPI nuclear stain (blue). (D) KRT23 expression decreased the proliferation of the colon cancer cell lines HCT15, HCT116 and SW480 significantly 48h post‐transfection when compared to a mock. Analyses were performed in 6 replicates each. (E) Visual inspection of KRT23 transfected cells at 24h post‐transfection showed that the number of viable HCT116 cells (MSI) following transfection with KRT23 is clearly reduced compared to SW480 cells (MSS) or compared to cells transfected with a GFP‐vector only (400× magnification). Immunofluorescence microscopy showed DAPI stained nuclei of HCT116 or SW480 24h posttransfection with KRT23. Remarkably, several giant cells were found in the SW480 cell population after transfection with KRT23.
Figure 7
Figure 7
Transcript profiling and correlation analysis of transcription factors CEBPA, CEBPB and HFH1/FOXQ1 (U133plus arrays). (A) Box‐Whisker plots representing normal mucosa (n=10), MSS (n=118) and MSI (n=35) tumors. (B) Spearman rank correlation and linear regression analyses comprising MSS and MSI tumors showed that KRT23 correlated significantly with CEBPA, CEBPB and HFH1/FOXQ1.
Figure 8
Figure 8
Involvement of KRT23 in the cell cycle: G1/S check point pathway. Transcript profiling data (U133plus2.0) from 10 normal colon mucosas were compared to those from 118 MSS colon adenocarcinomas. Transcripts of KRT23, DACH1, and CEBPB were strongly upregulated in MSS tumors (red), while SMAD3 and CDKN1A (p21/CIP) were downregulated (green) compared to normal mucosa (extracted from Supplementary Figure 4a).

References

    1. Archer, S.Y. , Meng, S. , Shei, A. , Hodin, R.A. , 1998. p21(WAF1) is required for butyrate-mediated growth inhibition of human colon cancer cells. Proc. Natl. Acad. Sci. U.S.A.. 95, 6791–6796. - PMC - PubMed
    1. Benatti, P. , Gafa, R. , Barana, D. , Marino, M. , Scarselli, A. , Pedroni, M. , Maestri, I. , Guerzoni, L. , Roncucci, L. , Menigatti, M. , Roncari, B. , Maffei, S. , Rossi, G. , Ponti, G. , Santini, A. , Losi, L. , Di, G.C. , Oliani, C. , Ponz de, L.M. , Lanza, G. , 2005. Microsatellite instability and colorectal cancer prognosis. Clin. Cancer Res.. 11, 8332–8340. - PubMed
    1. Birkenkamp-Demtroder, K. , Christensen, L.L. , Olesen, S.H. , Frederiksen, C.M. , Laiho, P. , Aaltonen, L.A. , Laurberg, S. , Sorensen, F.B. , Hagemann, R. , Orntoft, T.F. , 2002. Gene expression in colorectal cancer. Cancer Res.. 62, 4352–4363. - PubMed
    1. Birkenkamp-Demtroder, K. , Olesen, S.H. , Sorensen, F.B. , Laurberg, S. , Laiho, P. , Aaltonen, L.A. , Orntoft, T.F. , 2005. Differential gene expression in colon cancer of the caecum versus the sigmoid and rectosigmoid. Gut.. 54, 374–384. - PMC - PubMed
    1. Birkenkamp-Demtroder, K. , Wagner, L. , Sørensen, F.B. , Bording Astrup, L. , Gartner, W. , Scherubl, H. , Heine, B. , Christiansen, P. , Ørntoft, T.F. , 2005. Secretagogin is a novel marker for neuroendocrine differentiation. Neuroendocrinology. 82, 121–138. - PubMed

Publication types

MeSH terms