. 2008 Dec;2(4):356-67.
doi: 10.1016/j.molonc.2008.08.001. Epub 2008 Sep 4.

The CALM and CALM/AF10 interactor CATS is a marker for proliferation

Affiliations

The CALM and CALM/AF10 interactor CATS is a marker for proliferation

Leticia Fröhlich Archangelo et al. Mol Oncol. 2008 Dec.

Abstract

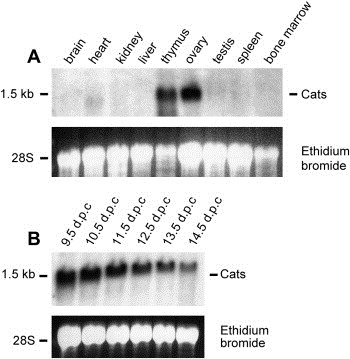
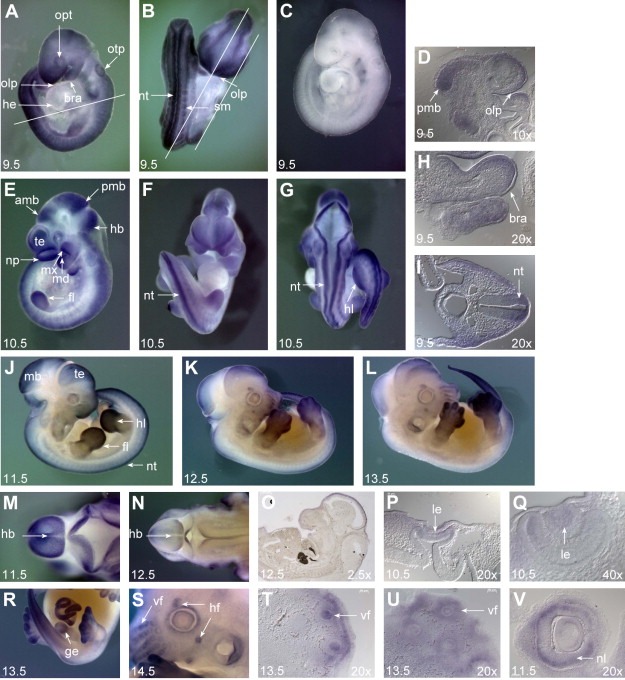
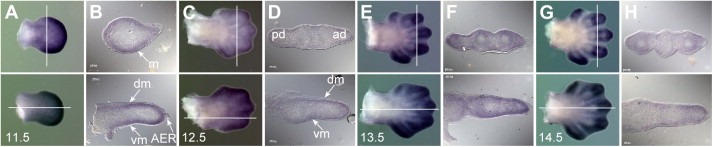
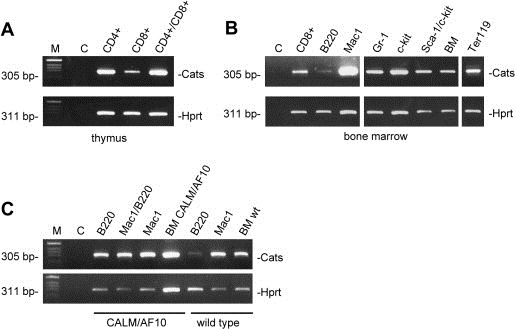
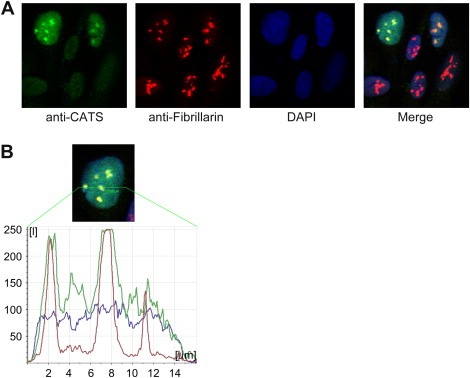
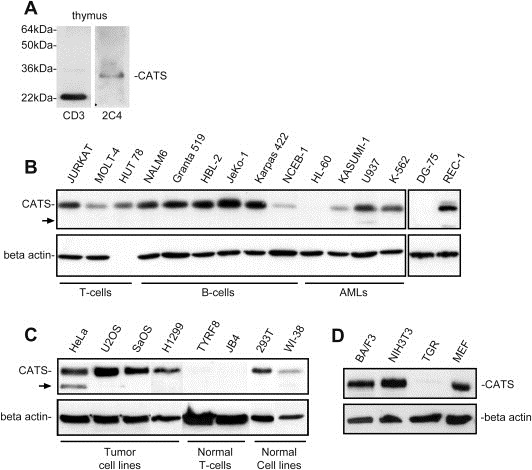
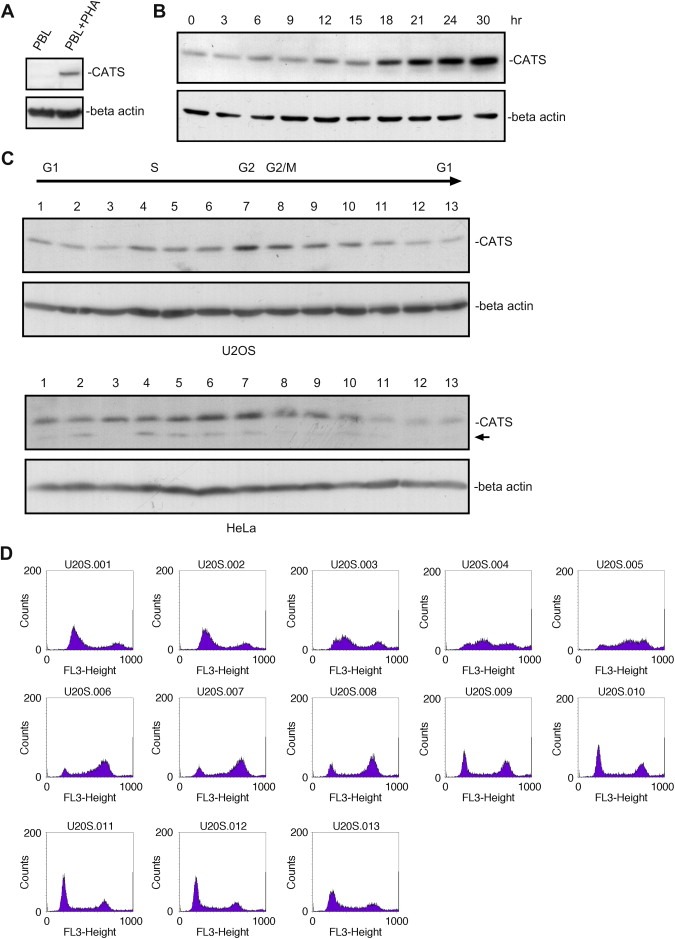
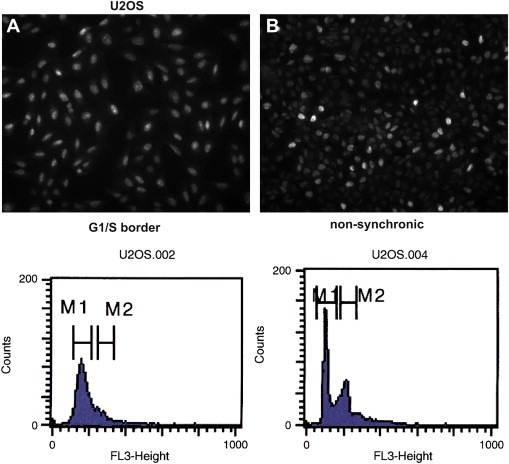
The CATS protein was recently identified as a novel CALM interacting protein. CATS increases the nuclear and specifically the nucleolar localization of the leukemogenic CALM/AF10 fusion protein. We cloned and characterized the murine Cats gene. Detailed analysis of murine Cats expression during mouse embryogenesis showed an association with rapidly proliferating tissues. Interestingly, the Cats transcript is highly expressed in murine hematopoietic cells transformed by CALM/AF10. The CATS protein is highly expressed in leukemia, lymphoma and tumor cell lines but not in non-proliferating T-cells or human peripheral blood lymphocytes. CATS protein levels are cell cycle dependent and it is induced by mitogens, suggesting a role of CATS in the control of cell proliferation and possibly CALM/AF10-mediated leukemogenesis.


Figures

Figure 1
Figure 1
Expression analysis of the murine Cats gene. (A) Multiple tissue Northern blot of adult mouse tissues. (B) Developmental Northern blot from whole mouse embryos of day 9.5 to 14.5d.p.c. Blots were hybridized with a Cats cDNA probe. The ethidium bromide stained gel is shown as loading control.
Figure 2
Figure 2
Whole mount in situ hybridization analysis during mouse embryonic development. Embryos were hybridized with the Cats antisense probe. (A, B, D, H, I) Expression of Cats at embryonic stage of 9.5d.p.c. Widespread transcript distribution with prominent expression in the neural tube (nt), somites (sm), posterior region of the midbrain (pmb), olfactory placode (olp) and in branchial arches (bra). Note the complete absence of Cats expression in the primitive heart (he). Otic pit: otp; optic vesicle: opt. Bars indicate the plane of section. (C) 9.5d.p.c. embryo hybridized with the Cats sense probe as a control for staining specificity. (E–G, P, Q) At 10.5d.p.c., there is a reduction of widespread Cats expression, transcripts are additionally detected in fore‐ and hindlimbs (fl and hl, respectively), telencephalon (te), nasal process (np), lens vesicle (le), anterior region of the midbrain (amb), hindbrain (hb) and mandibular and maxillary component of first branchial arch (md and mx, respectively). (J–L) Right lateral view of embryos from 11.5, 12.5 and 13.5d.p.c. Note reduction of Cats overall expression and prominent expression in the limbs. (M, N) Dorsal view of the cephalic region of 11.5 and 12.5d.p.c. embryos. Note the abrupt reduction of Cats expression in the hindbrain and neural tube from stage 11.5 to 12.5d.p.c. (O) Remaining Cats expression in the midbrain of a 12.5 embryo. (P–V) Transcripts detected in the lense vesicle (le), genital tubercle (ge), hair follicles (hf), vibrissae follicles (vf) and neural layer of optic cup (nl). (D, H, I, O–Q, T–V) Sagittal (D, H, O, T–V) and transverse (I, P, Q) sections from whole mount stained embryos. Stage of development and imaging magnification are indicated on the left and right bottom of the photographs, respectively.
Figure 3
Figure 3
Cats expression during limb development. In all panels the dorsal side of the limb is facing, the anterior side is to the top. The upper half of each figure shows a forelimb, the lower a hindlimb. Sections were generated from whole mount stained limb buds with 10× magnification (B, D, F, H). Bars indicate the plane of section. Transverse sections (forelimbs) are orientated with posterior side to the left, sagittal sections (hindlimbs) with the proximal side to the left. (A) Limb buds of a 11.5d.p.c. embryo. The expression of Cats is more prominent in the distal part of the paddle‐shaped fore‐ and hindlimb buds. (B) The transverse section shows staining in the underlying mesenchyme (m) and the sagittal section in the dorsal and ventral mesenchyme (dm and vm, respectively) but not in the apical ectodermal ridge (AER). (C) At 12.5d.p.c. Cats expression is still detected in the distal part of the polygonal‐shaped fore‐ and hindlimb buds. (D) Note stronger staining in the posterior domain (pd) rather than in the anterior domain (ad). (E, G) Distally, expression of Cats becomes confined to the digits in stages 13.5 and 14.5d.p.c.
Figure 4
Figure 4
Expression analysis of Cats on hematopoietic compartment of a normal and a CALM/AF10 leukemic mouse. RT‐PCR on cell populations purified from the murine thymus (A) and bone marrow (B). Samples are: T‐cells (CD4+, CD8+ and CD4+/CD8+), pro‐B cells (B220+), macrophages (Mac1+), pro‐erythrocytes (Ter119+), granulocytes (Gr‐1+), mast cells (c‐kit+), progenitor cells (Sca‐1+/c‐kit+) and whole bone marrow. (C) Analysis of Cats expression in leukemic cells derived from a CALM/AF10 murine bone marrow transplant model. Cats is expressed in the B220+/Mac1−, B220+/Mac1+, B220−/Mac1+ populations and whole bone marrow from a CALM/AF10 leukemic mouse. The controls used were B220+, Mac‐1 and whole bone marrow from a non‐leukemic mouse. Note the different levels of Cats expression in B220+ cells derived from a non‐leukemic and a leukemic mouse. Amplification of murine Hprt was used as control for RNA and cDNA integrity. BM: bone marrow; M: DNA size marker; C: negative control: no template.
Figure 5
Figure 5
Subcellular localization of endogenous CATS. Endogenous CATS was visualized by confocal microscopy in non‐synchronized U2OS cells. (A) CATS is a nuclear protein localized to the nucleolus of some cells. Note the different levels of CATS expression from cell to cell. (B) Confocal line scan through the nucleus of the upper left cell from panel A. The picture shows a cell with all three channels (Alexa 488 (CATS), Cy3 (Fibrillarin) and DAPI) merged. Note that the peak intensity of the CATS signal correlates with Fibrillarin staining of the nucleolar structures.
Figure 6
Figure 6
Western blot analysis of endogenous CATS using the α‐CATS 2C4 mAb. (A) CATS protein is expressed in human thymus. The α‐CD3 12 mAb, which detects CD3 epsilon in the cytoplasm, was used as a positive control to demonstrate the integrity of proteins in the thymus lysate. (B) CATS is highly expressed in leukemia and lymphoma cell lines. (C) CATS expression in normal and tumor cell lines. (D) Expression of Cats protein in murine cell lines (BA/F3, NIH3T3 and MEF) and a rat cell line (TGR). The α‐CATS 2C4 antibody recognizes the murine but not the rat protein. Arrows indicate the additional band found in cellular extracts of the CALM/AF10 fusion positive cell line U937 and in HeLa cell line. Blots were stripped and reprobed with an α‐beta actin antibody, which served as a control for the loading and integrity of the protein extracts.
Figure 7
Figure 7
CATS expression is upregulated in proliferating cells and is cell cycle dependent. (A) Primary human PBLs were stimulated for clonal expansion with PHA for 3days. Cell lysates were analysed by Western blotting using α‐CATS 2C4 antibody. CATS is not expressed in quiescent PBLs whereas the protein clearly accumulates in the proliferating cells. (B) T98G cells were serum stimulated after 48h of serum starvation. Cell extracts, prepared every 3h for up to 30h after stimulation were blotted and probed with α‐CATS 2C4 antibody. CATS is strongly upregulated in proliferating cells. Numbers indicate hours after serum stimulation. (0) Starved cells. (C) U2OS and HeLa cells were synchronized by a double thymidine block. CATS expression varies in the different stages of the cell cycle. Upregulation of CATS protein was observed in cell extracts corresponding the S, G2 and G2/M phases of the cell cycle (sample 4–11 from U2OS and samples 5–10 from HeLa). (D) FACS analysis of the U2OS samples (1–13). Sample 1 from HeLa lysates is from a non‐synchronized cell population, the arrow indicates the smaller CATS isoform expressed also in U937 cells. Blots were stripped and reprobed with α‐beta actin antibody.
Figure 8
Figure 8
The nucleolar localization of CATS is cell cycle dependent. Immunofluorescence microscopy of synchronized U2OS cells. (A) CATS is homogeneously expressed and localized at the nucleolar structures of every cell from a population blocked the G1/S boundary. (B) Heterogeneous expression and localization of CATS in non‐synchronized cells. The lower panels show the flow cytometry analysis of the same populations.

Similar articles

Cited by

References

    1. Archangelo, L.F. , Glasner, J. , Krause, A. , Bohlander, S.K. , 2006. The novel CALM interactor CATS influences the subcellular localization of the leukemogenic fusion protein CALM/AF10. Oncogene 25, (29) 4099–4109. - PubMed
    1. Asnafi, V. , Radford-Weiss, I. , Dastugue, N. , Bayle, C. , Leboeuf, D. , Charrin, C. , Garand, R. , Lafage-Pochitaloff, M. , Delabesse, E. , Buzyn, A. , 2003. CALM-AF10 is a common fusion transcript in T-ALL and is specific to the TCRgammadelta lineage. Blood 102, (3) 1000–1006. - PubMed
    1. Asnafi, V. , Beldjord, K. , Libura, M. , Villarese, P. , Millien, C. , Ballerini, P. , Kuhlein, E. , Lafage-Pochitaloff, M. , Delabesse, E. , Bernard, O. , 2004. Age-related phenotypic and oncogenic differences in T-cell acute lymphoblastic leukemias may reflect thymic atrophy. Blood 104, (13) 4173–4180. - PubMed
    1. Asnafi, V. , Buzyn, A. , Thomas, X. , Huguet, F. , Vey, N. , Boiron, J.M. , Reman, O. , Cayuela, J.M. , Lheritier, V. , Vernant, J.P. , 2005. Impact of TCR status and genotype on outcome in adult T-cell acute lymphoblastic leukemia: a LALA-94 study. Blood 105, (8) 3072–3078. - PubMed
    1. Ayton, P.M. , Cleary, M.L. , 2001. Molecular mechanisms of leukemogenesis mediated by MLL fusion proteins. Oncogene 20, (40) 5695–5707. - PubMed

Publication types

MeSH terms