

A model of action potentials and fast Ca2+ dynamics in pancreatic beta-cells
- PMID: 19383458
- PMCID: PMC2718303
- DOI: 10.1016/j.bpj.2009.01.029
A model of action potentials and fast Ca2+ dynamics in pancreatic beta-cells
Abstract
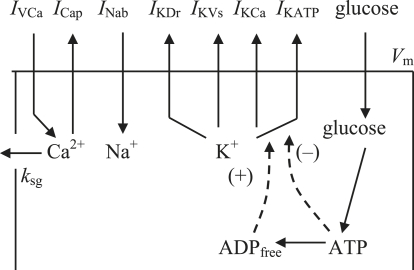
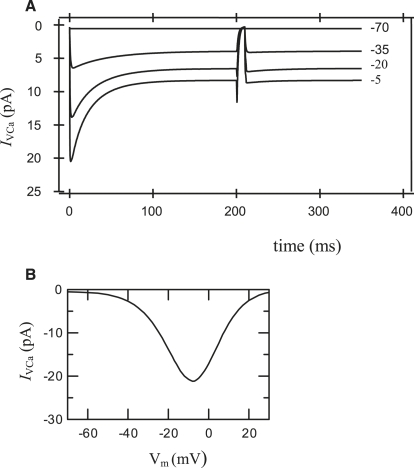
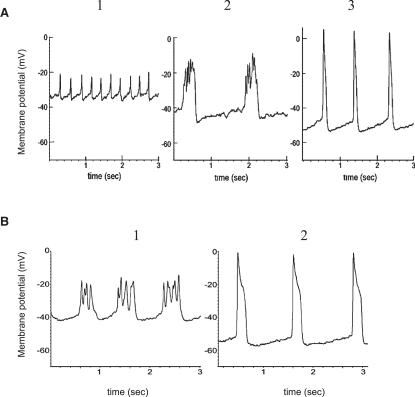
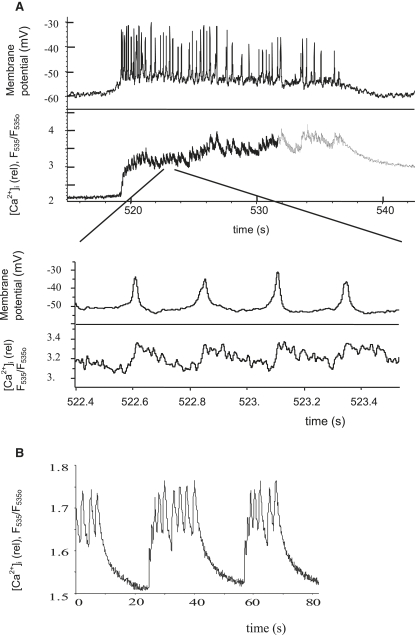
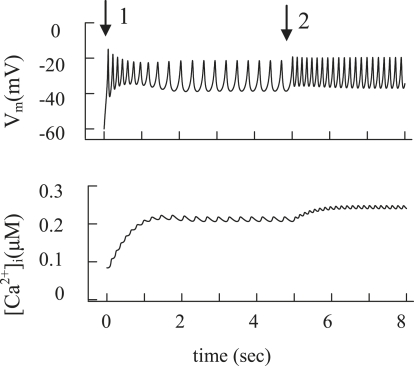
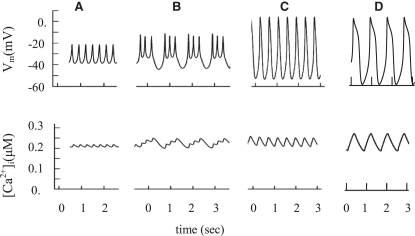
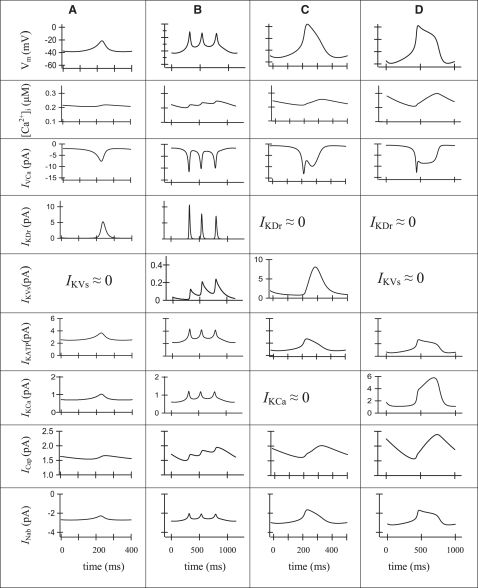
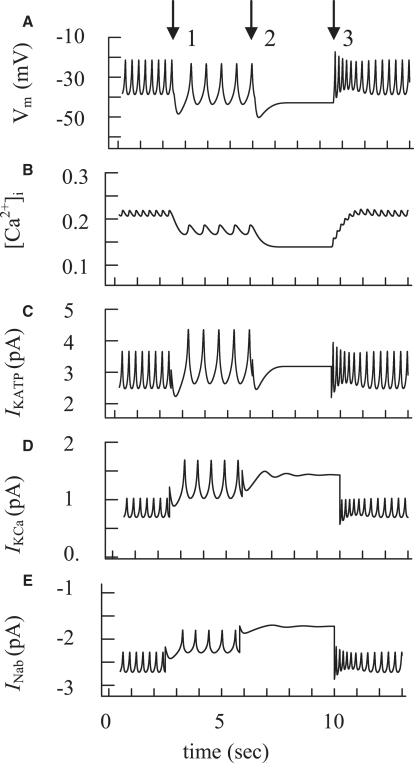
We examined the ionic mechanisms mediating depolarization-induced spike activity in pancreatic beta-cells. We formulated a Hodgkin-Huxley-type ionic model for the action potential (AP) in these cells based on voltage- and current-clamp results together with measurements of Ca(2+) dynamics in wild-type and Kv2.1 null mouse islets. The model contains an L-type Ca(2+) current, a "rapid" delayed-rectifier K(+) current, a small slowly-activated K(+) current, a Ca(2+)-activated K(+) current, an ATP-sensitive K(+) current, a plasma membrane calcium-pump current and a Na(+) background current. This model, coupled with an equation describing intracellular Ca(2+) homeostasis, replicates beta-cell AP and Ca(2+) changes during one glucose-induced spontaneous spike, the effects of blocking K(+) currents with different inhibitors, and specific complex spike in mouse islets lacking Kv2.1 channels. The currents with voltage-independent gating variables can also be responsible for burst behavior. Original features of this model include new equations for L-type Ca(2+) current, assessment of the role of rapid delayed-rectifier K(+) current, and Ca(2+)-activated K(+) currents, demonstrating the important roles of the Ca(2+)-pump and background currents in the APs and bursts. This model provides acceptable fits to voltage-clamp, AP, and Ca(2+) concentration data based on in silico analysis.
Figures
Similar articles
-
Delayed-rectifier (KV2.1) regulation of pancreatic beta-cell calcium responses to glucose: inhibitor specificity and modeling.Am J Physiol Endocrinol Metab. 2005 Oct;289(4):E578-85. doi: 10.1152/ajpendo.00054.2005. Epub 2005 Jul 12. Am J Physiol Endocrinol Metab. 2005. PMID: 16014354
-
Inhibition of Kv2.1 voltage-dependent K+ channels in pancreatic beta-cells enhances glucose-dependent insulin secretion.J Biol Chem. 2002 Nov 22;277(47):44938-45. doi: 10.1074/jbc.M205532200. Epub 2002 Sep 20. J Biol Chem. 2002. PMID: 12270920
-
Expression and function of pancreatic beta-cell delayed rectifier K+ channels. Role in stimulus-secretion coupling.J Biol Chem. 1996 Dec 13;271(50):32241-6. doi: 10.1074/jbc.271.50.32241. J Biol Chem. 1996. PMID: 8943282
-
Ionic mechanisms in pancreatic β cell signaling.Cell Mol Life Sci. 2014 Nov;71(21):4149-77. doi: 10.1007/s00018-014-1680-6. Epub 2014 Jul 23. Cell Mol Life Sci. 2014. PMID: 25052376 Free PMC article. Review.
-
Electrophysiology of islet cells.Adv Exp Med Biol. 2010;654:115-63. doi: 10.1007/978-90-481-3271-3_7. Adv Exp Med Biol. 2010. PMID: 20217497 Review.
Cited by
-
Pancreatic Beta Cell G-Protein Coupled Receptors and Second Messenger Interactions: A Systems Biology Computational Analysis.PLoS One. 2016 May 3;11(5):e0152869. doi: 10.1371/journal.pone.0152869. eCollection 2016. PLoS One. 2016. PMID: 27138453 Free PMC article.
-
Deconstructing the integrated oscillator model for pancreatic β-cells.Math Biosci. 2023 Nov;365:109085. doi: 10.1016/j.mbs.2023.109085. Epub 2023 Oct 4. Math Biosci. 2023. PMID: 37802364 Free PMC article.
-
A complete biomechanical model of Hydra contractile behaviors, from neural drive to muscle to movement.Proc Natl Acad Sci U S A. 2023 Mar 14;120(11):e2210439120. doi: 10.1073/pnas.2210439120. Epub 2023 Mar 10. Proc Natl Acad Sci U S A. 2023. PMID: 36897982 Free PMC article.
-
Modeling K,ATP--dependent excitability in pancreatic islets.Biophys J. 2014 Nov 4;107(9):2016-26. doi: 10.1016/j.bpj.2014.09.037. Biophys J. 2014. PMID: 25418087 Free PMC article.
-
Calcium and Metabolic Oscillations in Pancreatic Islets: Who's Driving the Bus?*.SIAM J Appl Dyn Syst. 2014;13(2):683-703. doi: 10.1137/130920198. SIAM J Appl Dyn Syst. 2014. PMID: 25698909 Free PMC article.
References
-
- Ashcroft F.M., Rorsman P. Electrophysiology of the pancreatic β-cell. Prog. Biophys. Mol. Biol. 1989;54:87–143. - PubMed
-
- Houamed K., Fu J., Roe M.W., Philipson L.H. Electrophysiology of the pancreatic β cell. In: LeRoith D., Taylor S.I., Olefsky J.O., editors. Diabetes Mellitus: A Fundamental and Clinical Text. 3rd ed. Lippincott, Williams and Wilkins; Philadelphia: 2004. pp. 51–68.
Publication types
MeSH terms
Substances
Grants and funding
LinkOut - more resources
Full Text Sources
Molecular Biology Databases
Miscellaneous
