. 2009 Apr 22;96(8):3210-22.
doi: 10.1016/j.bpj.2008.12.3923.

Lipid raft composition modulates sphingomyelinase activity and ceramide-induced membrane physical alterations

Affiliations

Lipid raft composition modulates sphingomyelinase activity and ceramide-induced membrane physical alterations

Liana C Silva et al. Biophys J. .

Abstract

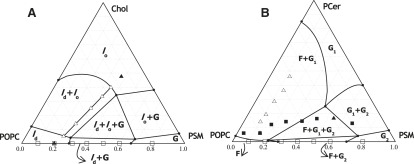
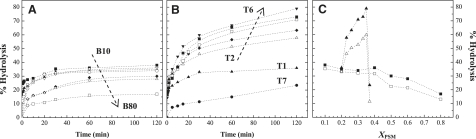
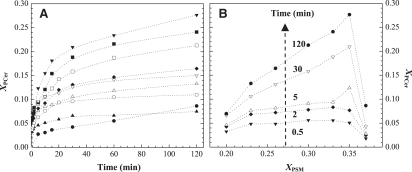
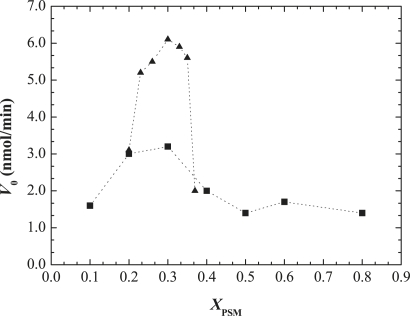
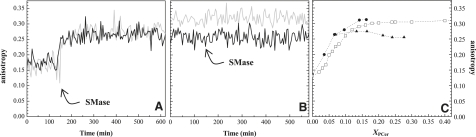
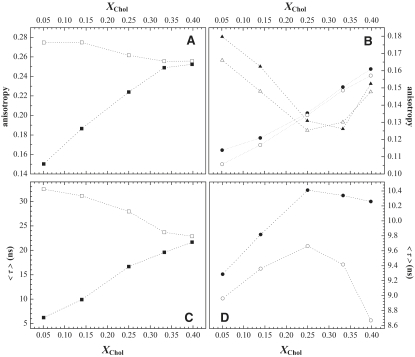
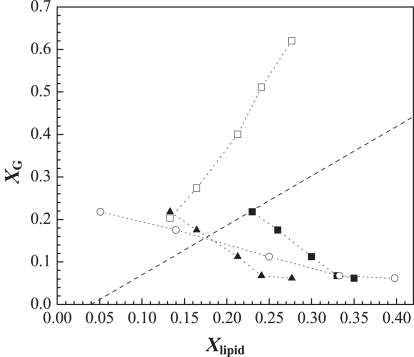
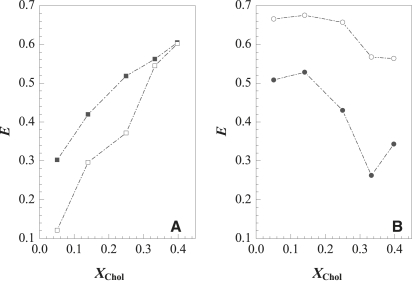
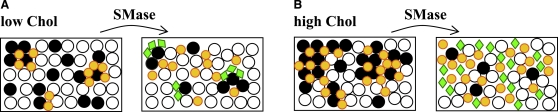
Lipid rafts and ceramide (Cer)-platforms are membrane domains that play an important role in several biological processes. Cer-platforms are commonly formed in the plasma membrane by the action of sphingomyelinase (SMase) upon hydrolysis of sphingomyelin (SM) within lipid rafts. The interplay among SMase activity, initial membrane properties (i.e., phase behavior and lipid lateral organization) and lipid composition, and the amount of product (Cer) generated, and how it modulates membrane properties were studied using fluorescence methodologies in model membranes. The activity of SMase was evaluated by following the hydrolysis of radioactive SM. It was observed that 1), the enzyme activity and extent of hydrolysis are strongly dependent on membrane physical properties but not on substrate content, and are higher in raft-like mixtures, i.e., mixtures with liquid-disordered/liquid-ordered phase separation; and 2), Cer-induced alterations are also dependent on membrane composition, specifically the cholesterol (Chol) content. In the lowest-Chol range, Cer segregates together with SM into small ( approximately 8.5 nm) Cer/SM-gel domains. With increasing Chol, the ability of Cer to recruit SM and form gel domains strongly decreases. In the high-Chol range, a Chol-enriched/SM-depleted liquid-ordered phase predominates. Together, these data suggest that in biological membranes, Chol in particular and raft domains in general play an important role in modulating SMase activity and regulating membrane physical properties by restraining Cer-induced alterations.


Figures

Figure 1
Figure 1
Ternary phase diagrams of (A) POPC/PSM/Chol (25) and (B) POPC/PSM/PCer (8). The ternary mixtures used in this study are represented in A. The solid triangles correspond to T1 and T7, the mixtures that are located in the one-phase region of the diagram (ld and lo, respectively), whereas the open triangles are the raft mixtures (T2–T6). ld, lo, and G are the liquid-disordered, liquid-ordered, and gel phases, respectively. See De Almeida et al. (25) for further details. The binary mixtures used in this study are represented in both A and B as open squares. The solid squares in B represent the mixtures that result from 2 h hydrolysis of the binary POPC/PSM vesicles. In B (▵,▴) correspond to the hydrolysis of the raft and nonraft ternary POPC/PSM/Chol mixtures, respectively. For these mixtures, the ratio between POPC, PSM-remaining, and PCer-formed was calculated assuming that Chol was not interfering with PCer/PSM interaction. F, G1, and G2 are the fluid, Cer-rich, and PSM-rich gel phases, respectively. See Castro et al. (8) for further details.
Figure 2
Figure 2
Relation among SMase activity, substrate content, and membrane properties. (A and B) Percentage of substrate hydrolyzed versus time in (A) POPC/PSM binary mixtures containing (▪) 10, (▴) 20, (○) 30, (▿) 40, (♦) 50, (▵) 60, and (□) 80% PSM, respectively; and (B) POPC/PSM/Chol ternary mixtures containing (▴) 20 (T1), (▵) 23 (T2), (♦) 26 (T3), (□) 30 (T4), (▪) 33 (T5), (▾) 35 (T6), and (•) 37% (T7) PSM, respectively. (C) Percentage of substrate hydrolyzed 30 min (open symbols) and 2 h (solid symbols) after starting the SMase reaction in binary (□,▪) and ternary (▵,▴) mixtures. The values are the means of at least three independent experiments. The standard deviation (SD) was always <3%.
Figure 3
Figure 3
Amount of PCer generated by PSM hydrolysis by SMase. (A) Fraction of PCer formed versus time in (○) 30% and (▿) 40% PSM-containing binary mixtures and in POPC/PSM/Chol ternary mixtures containing (▴) 20 (T1), (▵) 23 (T2), (♦) 26 (T3), (□) 30 (T4), (▪) 33 (T5), (▾) 35 (T6), and (•) 37% (T7) PSM, respectively. (B) Relationship between the fraction of PCer formed and the initial substrate available for hydrolysis in POPC/PSM/Chol ternary mixture at (▾) t = 0.5, (♦) 2, (▵) 5, (▿) 30, and (•) 120 min, respectively. The values are the means of at least three independent experiments. The SD was always <3%.
Figure 4
Figure 4
Dependence of the SMase initial reaction rate, Vo, on the amount of PSM. The initial rate of the reaction, Vo, was determined from the slope of a straight line tangent to the initial points of hydrolysis (2 min) in (▪) binary POPC/PSM and ternary (▴) POPC/PSM/Chol mixtures, respectively.
Figure 5
Figure 5
t-PnA fluorescence anisotropy in SMase-generated PCer mixtures. (A and B) Variation in the fluorescence anisotropy as a function of time in (A) ld POPC/PSM 80:20 binary (gray) and POPC/PSM/Chol 72:23:5 ternary (T2) mixtures (black); and (B) (black) lo POPC/PSM/Chol 25:35:40 ternary mixture (T6) and (gray) POPC/PSM 40:60 gel binary mixture. The arrow indicates the time at which SMase was added to the mixture. (C) t-PnA fluorescence anisotropy in (•) POPC/PSM and (▴) POPC/PSM/Chol 2 h after SMase addition. For comparison, t-PnA anisotropy in (□) POPC/PCer binary mixtures (15) is also plotted.
Figure 6
Figure 6
PCer-induced alterations in the membrane physical properties of raft mixtures. Fluorescence anisotropy of (A) (▪,□) t-PnA, and (B) (▴,▵) Rho-DOPE and (•,○) NBD-DPPE in the absence of SMase (solid symbols) and 2 h after SMase addition (open symbols). The mean fluorescence lifetimes of (C) t-PnA and (D) NBD-DPPE are shown (the symbols are the same as in A and B, respectively). The values are the means of at least three independent experiments. The SD was always lower than (A and B) 0.01, (C) 2 ns for t-PnA, and (D) 0.5 ns for NBD-DPPE.
Figure 7
Figure 7
Amount of gel phase formed in the raft mixtures as a function of (▴) PCer generated, (▪) total SL (PSM+PCer) present in the mixtures, and (○) Chol content. (□) XG predicted from the ternary POPC/PSM/PCer phase diagram (Fig. 1B) assuming that Chol is not affecting the interactions among the three other lipids. The dashed line corresponds to the amount of PCer-gel phase formed in POPC/PCer mixtures (15). See text and in the Supporting Material for further details on XG determination.
Figure 8
Figure 8
PCer-induced lateral lipid organization in raft mixtures. FRET efficiency, E, variation in the absence of SMase (solid symbols) and 2 h after SMase addition (open symbols) for (A) t-PnA/NBD-DPPE (D/A 1) and (B) NBD-DPPE/Rho-DOPE (D/A 2). The values are the average of at least three independent experiments, and the SD is <3%. Information regarding the relationship between gel/lo and ld/lo phases is obtained from A and B, respectively. The fraction of gel phase present and the size of PCer/PSM-enriched gel domains formed in the lowest Chol content are determined from these FRET data. See text for further details.
Figure 9
Figure 9
Schematic representation of SMase effects on raft membranes. (A) In the low-Chol range (small raft-size range, left panel), small PCer/PSM-enriched gel domains are formed upon PSM hydrolysis (right panel). (B) When Chol content is high (large raft-size range, left panel), SMase-generated PCer is not able to induce gel domain formation and lo-phase Chol-enriched/PSM-depleted predominates (right panel). The symbols represent (open circle) POPC, (solid circle) PSM, (small circle) Chol, and (diamond) Cer.

References

    1. Rajendran L., Simons K. Lipid rafts and membrane dynamics. J. Cell Sci. 2005;118:1099–1102. - PubMed
    1. Futerman A.H., Hannun Y.A. The complex life of simple sphingolipids. EMBO Rep. 2004;5:777–782. - PMC - PubMed
    1. Holthuis J.C.M., van Meer G., Huitema K. Lipid microdomains, lipid translocation and the organization of intracellular membrane transport. Mol. Membr. Biol. 2003;20:231–241. [Review] - PubMed
    1. Bollinger C.R., Teichgraber V., Gulbins E. Ceramide-enriched membrane domains. Biochim. Biophys. Acta. 2005;1746:284–294. - PubMed
    1. Gulbins E., Dreschers S., Wilker B., Grassme H. Ceramide, membrane rafts and infections. J. Mol. Med. 2004;82:357–363. - PubMed

Publication types

MeSH terms

LinkOut - more resources