

Bovine insulin filaments induced by reducing disulfide bonds show a different morphology, secondary structure, and cell toxicity from intact insulin amyloid fibrils
- PMID: 19383476
- PMCID: PMC2718267
- DOI: 10.1016/j.bpj.2008.12.3957
Bovine insulin filaments induced by reducing disulfide bonds show a different morphology, secondary structure, and cell toxicity from intact insulin amyloid fibrils
Abstract
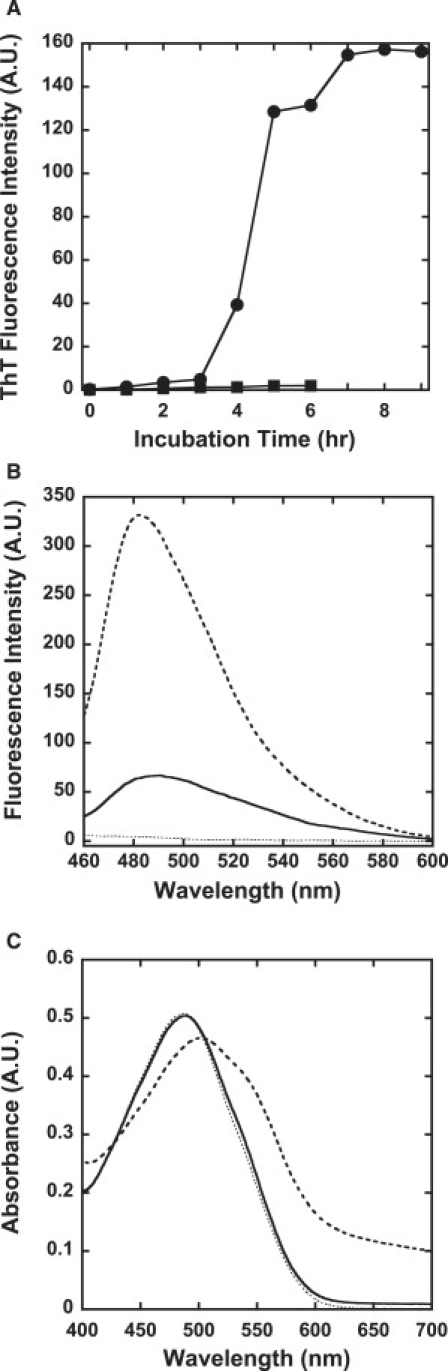
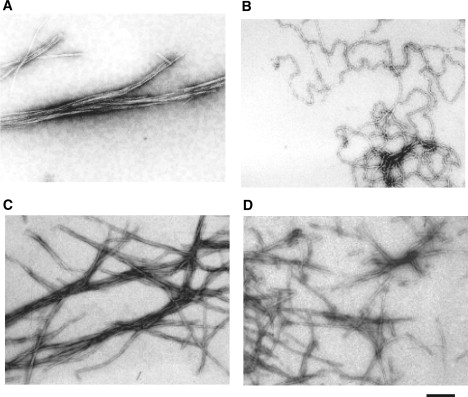
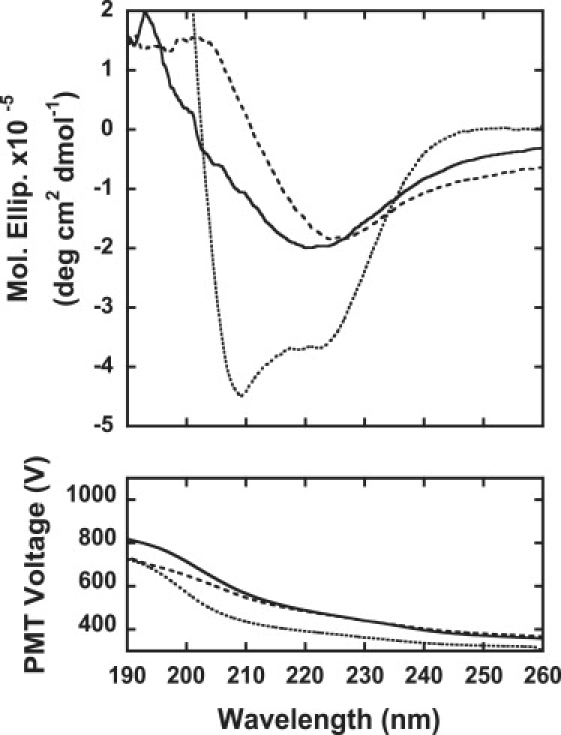
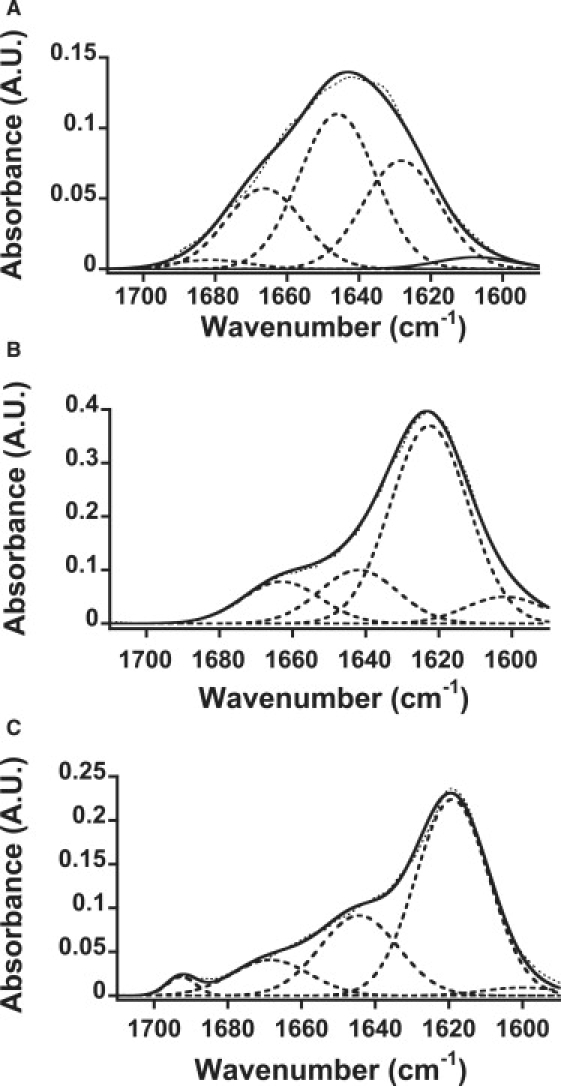
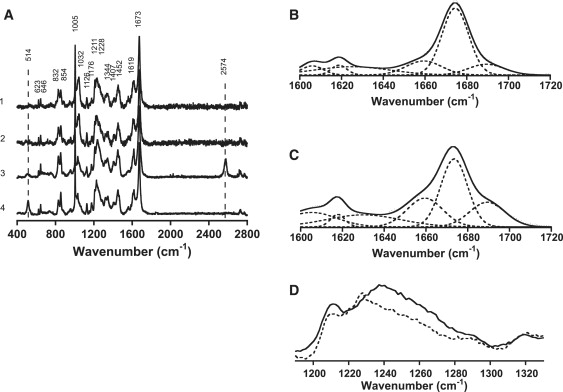
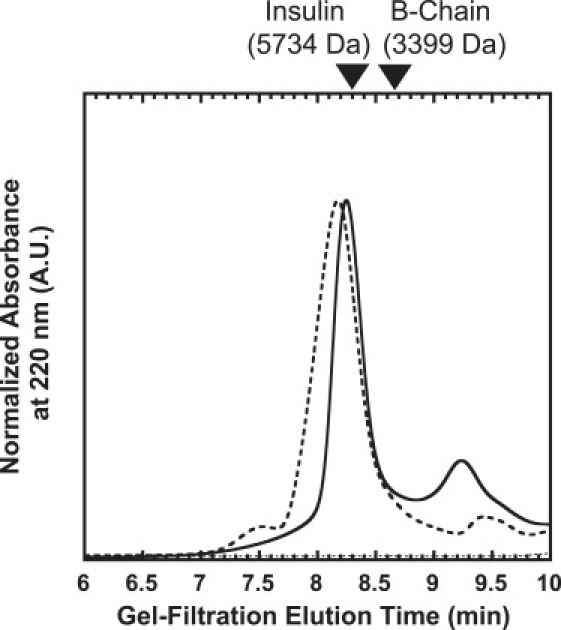
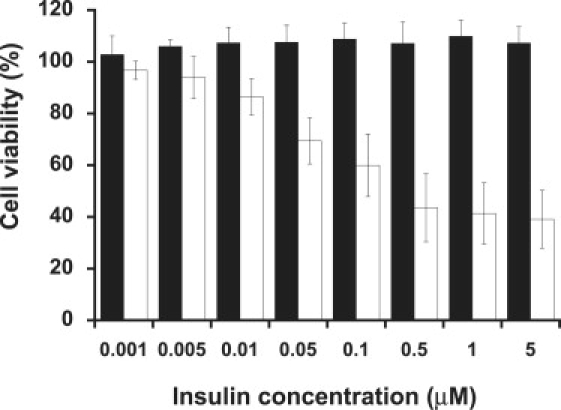
Amyloid fibrils are associated with more than 20 diseases, including Alzheimer's disease and type II diabetes. Insulin is a 51-residue polypeptide hormone, with its two polypeptide chains linked by one intrachain and two interchain disulfide bonds, and has long been known to self-assemble in vitro into amyloid fibrils. We demonstrate here that bovine insulin forms flexible filaments in the presence of a reducing agent, Tris (2-carboxyethyl) phosphine. The insulin filaments, possibly formed due to partial reduction of S-S bonds in insulin molecules, differ from intact insulin fibrils in terms of their secondary structure. The insulin filaments were determined to have an antiparallel beta-sheet structure, whereas the insulin fibrils have a parallel beta-sheet structure. Of importance, the cell toxicity of the insulin filaments was remarkably lower than that of the insulin fibrils. This finding supports the idea that cell toxicity of amyloids correlates with their morphology. The remarkably low toxicity of the filamentous structure should shed new light on possible pharmacological approaches to the various diseases caused by amyloid fibrils.
Figures
Similar articles
-
Fibrils formed in vitro from alpha-synuclein and two mutant forms linked to Parkinson's disease are typical amyloid.Biochemistry. 2000 Mar 14;39(10):2552-63. doi: 10.1021/bi991447r. Biochemistry. 2000. PMID: 10704204
-
Existence of different structural intermediates on the fibrillation pathway of human serum albumin.Biophys J. 2009 Mar 18;96(6):2353-70. doi: 10.1016/j.bpj.2008.12.3901. Biophys J. 2009. PMID: 19289061 Free PMC article.
-
Thioflavine-T and Congo Red reveal the polymorphism of insulin amyloid fibrils when probed by polarization-resolved fluorescence microscopy.J Phys Chem B. 2013 Jan 24;117(3):784-8. doi: 10.1021/jp309528f. Epub 2013 Jan 14. J Phys Chem B. 2013. PMID: 23289901
-
Formation mechanism of insulin fibrils and structural aspects of the insulin fibrillation process.Curr Protein Pept Sci. 2009 Oct;10(5):509-28. doi: 10.2174/138920309789352038. Curr Protein Pept Sci. 2009. PMID: 19538143 Review.
-
Techniques to study amyloid fibril formation in vitro.Methods. 2004 Sep;34(1):151-60. doi: 10.1016/j.ymeth.2004.03.012. Methods. 2004. PMID: 15283924 Review.
Cited by
-
Modulating Insulin Fibrillation Using Engineered B-Chains with Mutated C-Termini.Biophys J. 2019 Nov 5;117(9):1626-1641. doi: 10.1016/j.bpj.2019.09.022. Epub 2019 Sep 23. Biophys J. 2019. PMID: 31607389 Free PMC article.
-
Inhibition of insulin fibrillation by osmolytes: Mechanistic insights.Sci Rep. 2015 Nov 30;5:17599. doi: 10.1038/srep17599. Sci Rep. 2015. PMID: 26616401 Free PMC article.
-
Nanoscopic and photonic ultrastructural characterization of two distinct insulin amyloid states.Int J Mol Sci. 2012;13(2):1461-1480. doi: 10.3390/ijms13021461. Epub 2012 Feb 1. Int J Mol Sci. 2012. PMID: 22408402 Free PMC article.
-
Disulfide bridges remain intact while native insulin converts into amyloid fibrils.PLoS One. 2012;7(6):e36989. doi: 10.1371/journal.pone.0036989. Epub 2012 Jun 1. PLoS One. 2012. PMID: 22675475 Free PMC article.
-
Role of the Disulfide Bond in Prion Protein Amyloid Formation: A Thermodynamic and Kinetic Analysis.Biophys J. 2018 Feb 27;114(4):885-892. doi: 10.1016/j.bpj.2017.12.031. Biophys J. 2018. PMID: 29490248 Free PMC article.
References
-
- Dobson C.M. Protein folding and misfolding. Nature. 2003;426:884–890. - PubMed
-
- Ross C.A., Poirier M.A. Protein aggregation and neurodegenerative disease. Nat. Med. 2004;10:S10–S17. - PubMed
-
- Uversky V.N., Fink A.L. Conformational constraints for amyloid fibrillation: the importance of being unfolded. Biochim. Biophys. Acta. 2004;1698:131–153. - PubMed
-
- Blake C., Serpell L. Synchrotron X-ray studies suggest that the core of the transthyretin amyloid fibril is a continuous β-sheet helix. Structure. 1996;4:989–998. - PubMed
-
- Nilsson M.R. Techniques to study amyloid fibril formation in vitro. Methods. 2004;34:151–160. - PubMed
Publication types
MeSH terms
Substances
LinkOut - more resources
Full Text Sources
Medical
