. 2009 Apr 22;96(8):3341-53.
doi: 10.1016/j.bpj.2009.01.015.

Obstacles on the microtubule reduce the processivity of Kinesin-1 in a minimal in vitro system and in cell extract

Affiliations

Obstacles on the microtubule reduce the processivity of Kinesin-1 in a minimal in vitro system and in cell extract

Ivo A Telley et al. Biophys J. .

Abstract

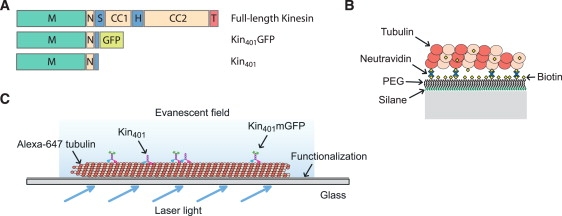
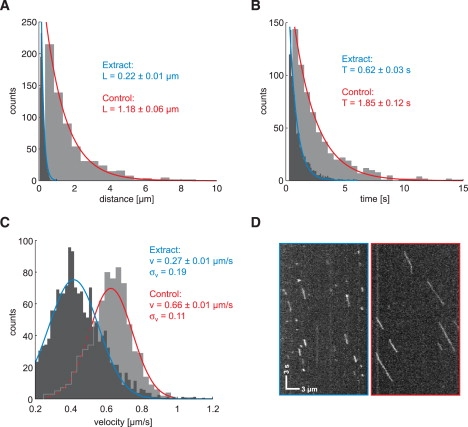
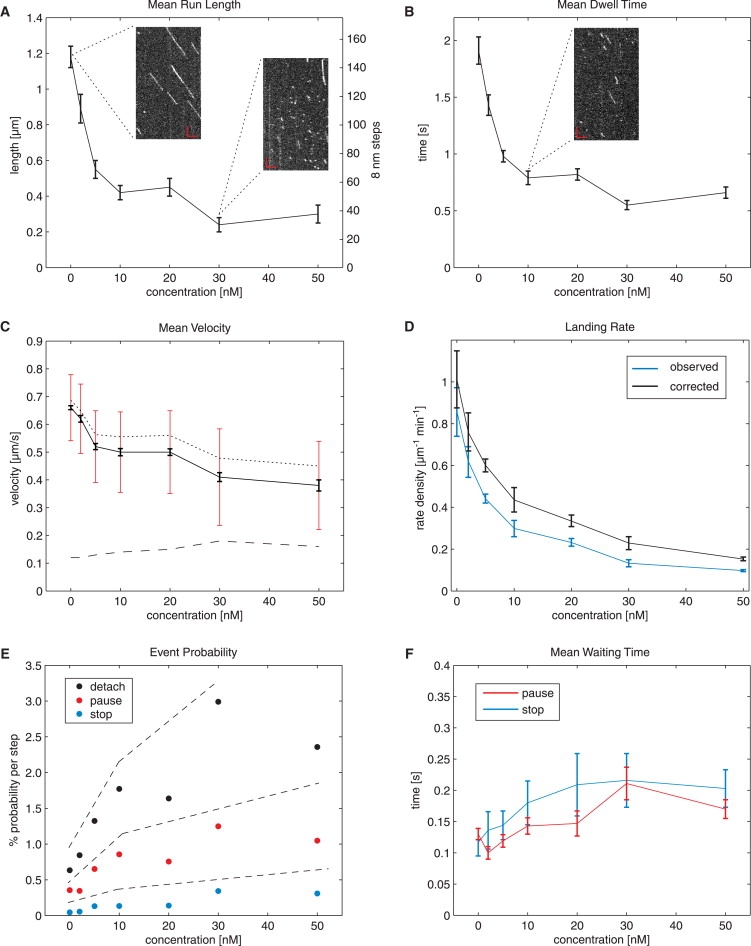
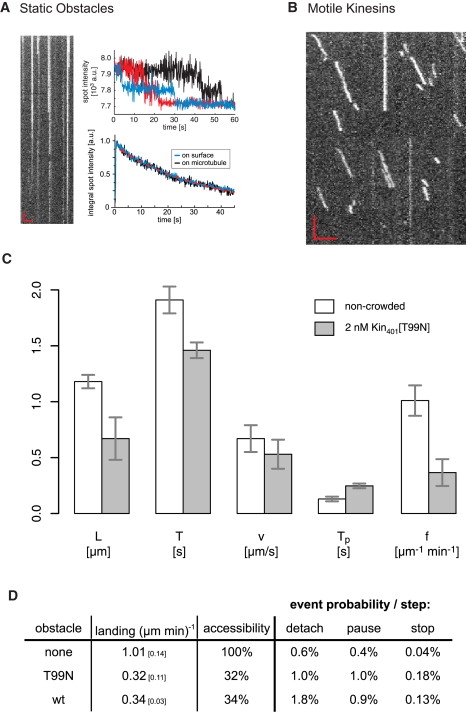
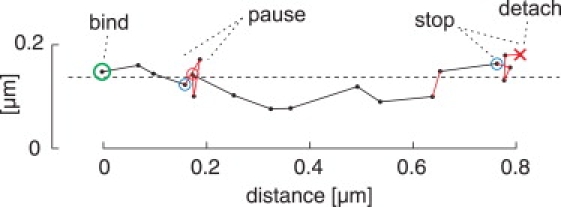
Inside cells, a multitude of molecular motors and other microtubule-associated proteins are expected to compete for binding to a limited number of binding sites available on microtubules. Little is known about how competition for binding sites affects the processivity of molecular motors and, therefore, cargo transport, organelle positioning, and microtubule organization, processes that all depend on the activity of more or less processive motors. Very few studies have been performed in the past to address this question directly. Most studies reported only minor effects of crowding on the velocity of motors. However, a controversy appears to exist regarding the effect of crowding on motor processivity. Here, we use single-molecule imaging of mGFP-labeled minimal dimeric kinesin-1 constructs in vitro to study the effects of competition on kinesin's processivity. For competitors, we use kinesin rigor mutants as static roadblocks, minimal wild-type kinesins as motile obstacles, and a cell extract as a complex mixture of microtubule-associated proteins. We find that mGFP-labeled kinesin-1 detaches prematurely from microtubules when it encounters obstacles, leading to a strong reduction of its processivity, a behavior that is largely independent of the type of obstacle used here. Kinesin has a low probability to wait briefly when encountering roadblocks. Our data suggest, furthermore, that kinesin can occasionally pass obstacles on the protofilament track.


Figures

Figure 1
Figure 1
Kinesin constructs and experimental assay. (A) Comparison of the domains of the truncated and mGFP-labeled kinesin-1 construct, with the native full-length kinesin. M, motor domain; N, neck linker; S, swivel; CC, coiled coil; H, hinge; T, tail. (B) Detailed scheme of the surface components involved for immobilization of stabilized microtubules. PEG, polyethyleneglycol. (C) Overview of the assay, allowing single-molecule imaging in buffer and cell extract. An evanescent field emerging from totally reflected laser light at the functionalized side of the glass slide excites the fluorophores in close proximity to the surface.
Figure 2
Figure 2
Motility of kinesin-1 in cell extract. The motile characteristics of Kin401mGFP in insect cell extract (black) are compared with those in the assay buffer used as control (gray). The histograms were fitted with associated distribution functions, and fitting parameters and 95% confidence intervals are presented for extract (blue) and buffer (red). (A) The run lengths (i.e., travel distances) are exponentially distributed for both conditions, but the mean length is >80% smaller in extract compared to control. (B) In a similar way, the dwell (i.e., association) times of kinesin with the microtubule are exponentially distributed and generally reduced in extract. (C) The mean velocities show a Gaussian distribution. The center of the distribution is downshifted in extract, and the width (σv) is slightly increased, suggesting greater variability compared to the control. (D) Exemplary space-time plot (kymograph) of the mGFP signal along a microtubule in the extract (left) and in buffer (right), confirming the results seen in AC of short and generally slower runs in extract. Scale bars apply for both images.
Figure 3
Figure 3
Changes in motility with increasing kinesin crowding on microtubules in buffer. Dependence of mean run length (A) and mean dwell time (B) of Kin401mGFP on the total concentration of kinesin, as determined from distributions as presented in Fig. 2. All runs, with and without pauses and stops, were included in the analysis. Exemplary kymographs (insets) show typical runs in the presence of 0, 10, and 30 nM Kin401. The largest effect is seen in the range 0–10 nM, whereas the curve flattens for higher concentrations. Scale bars, 3 μm (horizontal) and 3 s (vertical). (C) Shift and broadening of the velocity distribution with increase in crowding. Black error bars denote the 95% confidence interval of the peak value of the (Gaussian) distribution as shown in Fig. 2C, and red error bars denote the standard deviation (see also dashed line) of the distribution. The dotted curve represents the mean velocity analyzed from tracks without detectable pauses and stops. (D) Landing rate normalized to microtubule length as a function of kinesin concentration, as observed in the experiment (blue) and corrected (black) according to Appendix A. (E) Relationship between the concentration of kinesin and the probability per 8-nm step of the three events, “detach” (black), “pause” (red), and “stop” (blue), determined from the run length and frequency of detected pauses and stops. Detachment has the highest probability for all concentrations measured. Dashed lines emphasize the three regimes for these probabilities. (F) Mean pause (red) and stop (blue) durations both tend to increase (by a factor of ∼2) for the concentrations measured here. Note that no significant difference was seen between the two parameters. If not otherwise stated, error bars represent the 95% confidence interval.
Figure 4
Figure 4
Crowding with a static obstacle. (A) Results of an experiment in which microtubules were incubated with 10 pM of labeled mutant (rigor) kinesin, which were then imaged in the presence of 2 nM unlabeled wild-type kinesin. The kymograph (left) shows that kinesins bound statically to microtubules, and signal spots typically disappear in a two-step fashion (upper right), indicating that these were indeed single dimers. Analysis of the integrated signal of a population (lower right) indicated that the disappearance of spots followed the same time constant as normal bleaching (typically ∼30 s from exponential fit, dashed red line) of kinesins nonspecifically attached to the surface, demonstrating that mutant kinesins did not dissociate because of high molecular crowding. (B) Sample kymograph of the signal from Kin401mGFPs on a microtubule that were incubated with 2 nM mutant kinesin as roadblock. Red scale bars are as in Fig. 3A. (C) Mean values of run length (L), dwell time (T), velocity (v), pause time (Tp) and landing rate (f) of Kin401mGFP with (gray) and without (white) prior incubation with mutant kinesin as roadblock. Changes are generally similar to those seen in the wild-type crowding experiment. Error bars represent the 95% confidence interval. (D) Comparison of the event probabilities per 8-nm step for detachment, pause, and stop at the end of a run in control conditions (no obstacles), with roadblocks (T99N) or with motile obstacles (wild-type kinesin). The conditions compared were those for which the concentration of obstacle gave similar landing (mean and 95% confidence) and thus indicated similar accessibility to the microtubule (32–34%). Both obstacles increased the pausing and stopping probability of Kin401mGFP to the same degree, whereas the probability of detachment with motile kinesins was almost twice that with roadblocks.
Figure 5
Figure 5
Pause and stop events. Sample plot of the automatically tracked position of Kin401mGFP (dots) for consecutive frames, indicated by the interconnecting lines. The binding (landing) is highlighted with a green circle and the detachment with a red cross. A waiting period is considered a “stop” when it occurs at the end of the run; otherwise, it is considered a “pause”. The main axis of displacement is indicated by the dashed line and refers to the microtubule axis. Red and blue circles represent the beginning and end, respectively, of a detected waiting period.

Similar articles

Cited by

References

    1. Howard J. Sinauer Associates; Sunderland, MA: 2001. Mechanics of Motor Proteins and the Cytoskeleton.
    1. Ross J.L., Ali M.Y., Warshaw D.M. Cargo transport: molecular motors navigate a complex cytoskeleton. Curr. Opin. Cell Biol. 2008;20:41–47. - PMC - PubMed
    1. Nogales E. Structural insight into microtubule function. Annu. Rev. Biophys. Biomol. Struct. 2001;30:397–420. - PubMed
    1. Goldstein L.S., Philp A.V. The road less traveled: emerging principles of kinesin motor utilization. Annu. Rev. Cell Dev. Biol. 1999;15:141–183. - PubMed
    1. Gross S.P., Vershinin M., Shubeita G.T. Cargo transport: two motors are sometimes better than one. Curr. Biol. 2007;17:R478–R486. - PubMed

Publication types

LinkOut - more resources