

Structural changes in the catalytic cycle of the Na+,K+-ATPase studied by infrared spectroscopy
- PMID: 19383486
- PMCID: PMC2718309
- DOI: 10.1016/j.bpj.2009.01.010
Structural changes in the catalytic cycle of the Na+,K+-ATPase studied by infrared spectroscopy
Abstract
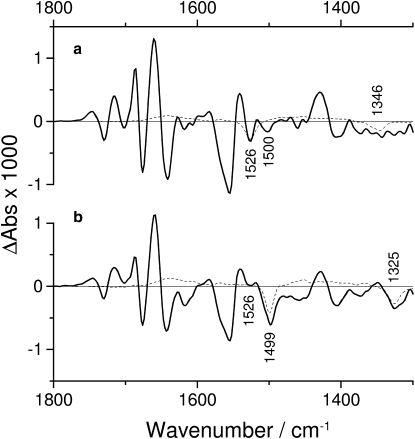
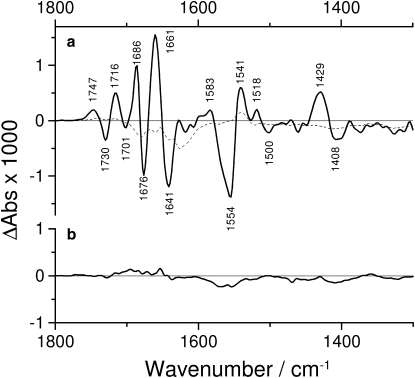
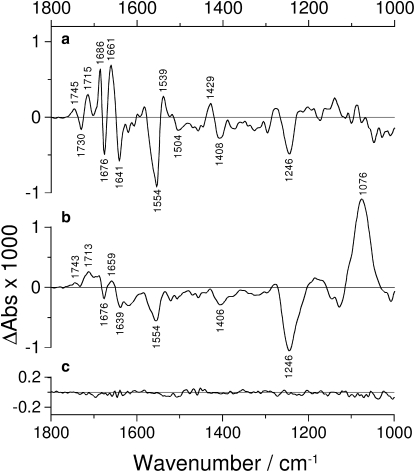
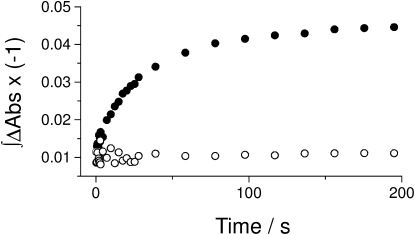
Pig kidney Na(+),K(+)-ATPase was studied by means of reaction-induced infrared difference spectroscopy. The reaction from E1Na(3)(+) to an E2P state was initiated by photolysis of P(3)-1-(2-nitrophenyl)ethyl ATP (NPE caged ATP) in samples that contained 3 mM free Mg(2+) and 130 mM NaCl at pH 7.5. Release of ATP from caged ATP produced highly detailed infrared difference spectra indicating structural changes of the Na(+),K(+)-ATPase. The observed transient state of the enzyme accumulated within seconds after ATP release and decayed on a timescale of minutes at 15 degrees C. Several controls ensured that the observed difference signals were due to structural changes of the Na(+),K(+)-ATPase. Samples that additionally contained 20 mM KCl showed similar spectra but less intense difference bands. The absorbance changes observed in the amide I region, reflecting conformational changes of the protein backbone, corresponded to only 0.3% of the maximum absorbance. Thus the net change of secondary structure was concluded to be very small, which is in line with movement of rigid protein segments during the catalytic cycle. Despite their small amplitude, the amide I signals unambiguously reveal the involvement of several secondary structure elements in the conformational change. Similarities and dissimilarities to corresponding spectra of the Ca(2+)-ATPase and H(+),K(+)-ATPase are discussed, and suggest characteristic bands for the E1 and E2 conformations at 1641 and 1661 cm(-1), respectively, for alphabeta heterodimeric ATPases. The spectra further indicate the participation of protonated carboxyl groups or lipid carbonyl groups in the reaction from E1Na(3)(+) to an E2P state. A negative band at 1730 cm(-1) is in line with the presence of a protonated Asp or Glu residue that coordinates Na(+) in E1Na(3)(+). Infrared signals were also detected in the absorption regions of ionized carboxyl groups.
Figures
Similar articles
-
Structural changes of the sarcoplasmic reticulum Ca(2+)-ATPase upon nucleotide binding studied by fourier transform infrared spectroscopy.Biophys J. 2000 Mar;78(3):1531-40. doi: 10.1016/S0006-3495(00)76705-1. Biophys J. 2000. PMID: 10692337 Free PMC article.
-
Infrared spectroscopic signals arising from ligand binding and conformational changes in the catalytic cycle of sarcoplasmic reticulum calcium ATPase.Biochim Biophys Acta. 1991 Mar 1;1057(1):115-23. doi: 10.1016/s0005-2728(05)80091-x. Biochim Biophys Acta. 1991. PMID: 1826215
-
The conformation of H,K-ATPase determines the nucleoside triphosphate (NTP) selectivity for active proton transport.Biochemistry. 2007 Sep 4;46(35):10145-52. doi: 10.1021/bi700991n. Epub 2007 Aug 14. Biochemistry. 2007. PMID: 17696364
-
Kinetics of Na(+)-dependent conformational changes of rabbit kidney Na+,K(+)-ATPase.Biophys J. 1998 Sep;75(3):1340-53. doi: 10.1016/S0006-3495(98)74052-4. Biophys J. 1998. PMID: 9726935 Free PMC article.
-
Structure and mechanism of Na,K-ATPase: functional sites and their interactions.Annu Rev Physiol. 2003;65:817-49. doi: 10.1146/annurev.physiol.65.092101.142558. Epub 2002 May 1. Annu Rev Physiol. 2003. PMID: 12524462 Review.
Cited by
-
Na+/K+-ATPase Revisited: On Its Mechanism of Action, Role in Cancer, and Activity Modulation.Molecules. 2021 Mar 28;26(7):1905. doi: 10.3390/molecules26071905. Molecules. 2021. PMID: 33800655 Free PMC article. Review.
-
Time-resolved Fourier transform infrared spectroscopy of the nucleotide-binding domain from the ATP-binding Cassette transporter MsbA: ATP hydrolysis is the rate-limiting step in the catalytic cycle.J Biol Chem. 2012 Jul 6;287(28):23923-31. doi: 10.1074/jbc.M112.359208. Epub 2012 May 16. J Biol Chem. 2012. PMID: 22593573 Free PMC article.
References
-
- Skou J.C. The influence of some cations on an adenosine triphosphatase from pheripheral nerves. Biochim. Biophys. Acta. 1957;23:394–401. - PubMed
-
- Rolfe D.F.S., Brown G.C. Cellular energy utilization and molecular origin of standard metabolic rate in mammals. Physiol. Rev. 1997;77:731–758. - PubMed
-
- Axelsen K.B., Palmgren M.G. Evolution of substrate specificities in the P-type ATPase superfamily. J. Mol. Evol. 1998;46:84–101. - PubMed
-
- Hasselbach W., Makinose M. Die Calciumpumpe der “Erschlaffungsgrana” des Muskels und ihre Abhängigkeit von der ATP-Spaltung [The calcium pump of the relaxing granules of muscle and its dependence on ATP splitting] Biochem. Z. 1961;333:518–528. - PubMed
-
- Geering K. The functional role of β subunits in oligomeric P-type ATPases. J. Bioenerg. Biomembr. 2001;33:425–438. - PubMed
MeSH terms
Substances
LinkOut - more resources
Full Text Sources
Miscellaneous
