. 2009 May 5;106(18):7479-84.
doi: 10.1073/pnas.0811129106. Epub 2009 Apr 21.

Muscle hypertrophy driven by myostatin blockade does not require stem/precursor-cell activity

Affiliations

Muscle hypertrophy driven by myostatin blockade does not require stem/precursor-cell activity

Helge Amthor et al. Proc Natl Acad Sci U S A. .

Abstract

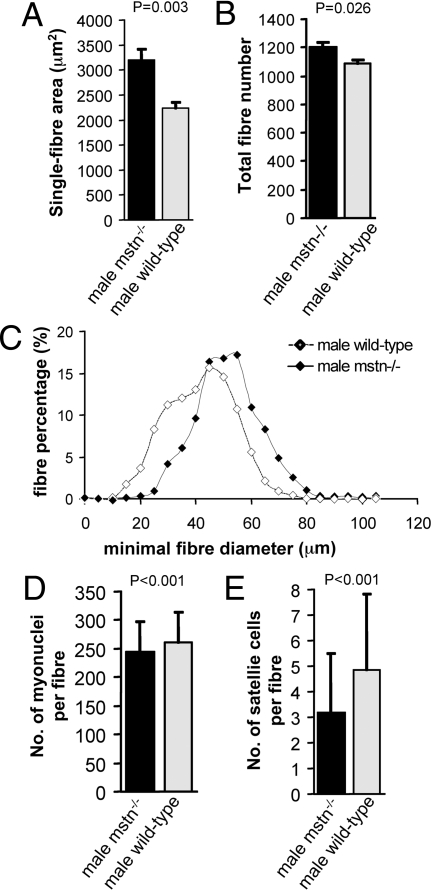
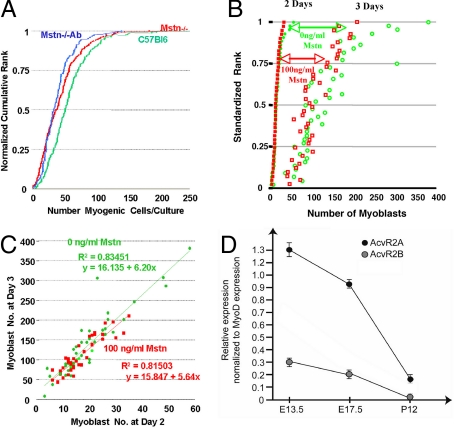
Myostatin, a member of the TGF-beta family, has been identified as a powerful inhibitor of muscle growth. Absence or blockade of myostatin induces massive skeletal muscle hypertrophy that is widely attributed to proliferation of the population of muscle fiber-associated satellite cells that have been identified as the principle source of new muscle tissue during growth and regeneration. Postnatal blockade of myostatin has been proposed as a basis for therapeutic strategies to combat muscle loss in genetic and acquired myopathies. But this approach, according to the accepted mechanism, would raise the threat of premature exhaustion of the pool of satellite cells and eventual failure of muscle regeneration. Here, we show that hypertrophy in the absence of myostatin involves little or no input from satellite cells. Hypertrophic fibers contain no more myonuclei or satellite cells and myostatin had no significant effect on satellite cell proliferation in vitro, while expression of myostatin receptors dropped to the limits of detectability in postnatal satellite cells. Moreover, hypertrophy of dystrophic muscle arising from myostatin blockade was achieved without any apparent enhancement of contribution of myonuclei from satellite cells. These findings contradict the accepted model of myostatin-based control of size of postnatal muscle and reorient fundamental investigations away from the mechanisms that control satellite cell proliferation and toward those that increase myonuclear domain, by modulating synthesis and turnover of structural muscle fiber proteins. It predicts too that any benefits of myostatin blockade in chronic myopathies are unlikely to impose any extra stress on the satellite cells.


Conflict of interest statement

The authors declare no conflict of interest.

Figures

Fig. 1.
Fig. 1.
Morphometric and cellular properties of EDL muscles from adult male mstn−/− mice compared to age-matched C57BL/6 wild types. (A) Total fiber number of whole EDL muscles from mstn−/− mice (black column) compared to wild types (gray column) (P = 0.026). (B) EDL fiber area from Mstn−/− mice (black column) compared to wild types (gray column) (P = 0.003). (C) Fiber size distribution in the EDL from mstn−/− mice (black diamonds) and wild-type mice (white diamonds). (D) Number of myonuclei per isolated muscle fiber from EDL muscles from mstn−/− mice (black column) compared to wild types (gray column) (P < 0.001). (E) Number of Pax-7 positive satellite cells per isolated muscle fiber from EDL muscles from mstn−/− mice (black column) compared to wild types (gray column) (P < 0.001).
Fig. 2.
Fig. 2.
Analysis of muscle fibers. (A) Part of an isolated fiber from wild-type EDL, combined immunostaining against Pax-7 (green), and nuclear stain with DAPI (blue). The image depicts 1 satellite cell (arrow) and numerous myonuclei. (B) Example of a culture of an isolated muscle fiber (arrow) from wild-type EDL muscle after 3 days of in vitro incubation. Numerous myoblasts are present in the proximity of the muscle fiber, which are visible as little dots at this magnification in phase microscopy. (C) Immunostaining against revertant fibers on a cross-section of EDL muscle from mstn+/+mdx mouse depicts 2 clusters of revertant fibers (3 and 13 revertant fibers, respectively, arrows) and 1 paler isolated revertant fiber (arrowhead).
Fig. 3.
Fig. 3.
Analysis of responsiveness of primary myoblasts to myostatin. (A) Influence of myostatin on myoblast proliferation. Data are shown as cumulative rank ogives of the numbers of myoblasts accumulating around isolated fiber cultures from wild-type mice (green), mstn−/− mice (red), and J16-antibody-treated cultures of isolated fibers from mstn−/− mice (blue). The number of cells that had accumulated around each single myofiber during 72 h in tissue culture is plotted on the horizontal axis. The vertical axis is the individual ranks, normalized to the rank total for each experiment to permit comparison of data sets of different sample size. (B) Effect of myostatin on growth of primary cultures of satellite cells from single myofibers isolated from wild-type mice. After 2 days in culture, 100 ng/mL myostatin was added to half of the cultures (full red squares) but not to the control group (full green circles). The numbers of cells present 1 day later in each individual culture are displayed as empty red squares for the myostatin-treated and open green circles for the nontreated cultures, pairing the data for each culture between days 2 and 3. (C) Plot of the data from B of the cell number present at day 2 against that in the same culture on day 3 in cultures treated with myostatin (red squares) and in controls (green circles). The regression lines for myostatin-treated cultures (red) and controls (green) are shown with mean square error of prediction (R2) and regression equation that indicates the rate of cell increase before and after treatment with myostatin. (D) Expression profiling of activin receptors during muscle progenitor maturation. Real-time PCR comparing of activin receptors 2 a and b expression in Pax3GFP/+ muscle progenitors during embryonic (E13.5), fetal (E17.5), and postnatal (P12) stages. The relative levels of expression of activin receptors AcvR2A and AcvR2B, shown normalized to MyoD expression, decrease dramatically between early development and the neonatal growth phase.

Similar articles

Cited by

References

    1. McPherron AC, Lawler AM, Lee S-J. Regulation of skeletal muscle mass in mice by a new TGF-β superfamily member. Nature. 1997;387:83–90. - PubMed
    1. Bogdanovich S, et al. Functional improvement of dystrophic muscle by myostatin blockade. Nature. 2002;420:418–421. - PubMed
    1. Wagner KR, McPherron AC, Winik N, Lee SJ. Loss of myostatin attenuates severity of muscular dystrophy in mdx mice. Ann Neurol. 2002;52:832–836. - PubMed
    1. McCroskery S, Thomas M, Maxwell L, Sharma M, Kambadur R. Myostatin negatively regulates satellite cell activation and self-renewal. J Cell Biol. 2003;162:1135–1147. - PMC - PubMed
    1. McCroskery S, et al. Improved muscle healing through enhanced regeneration and reduced fibrosis in myostatin-null mice. J Cell Sci. 2005;118:3531–3541. - PubMed

Publication types

LinkOut - more resources