

A simple clinical predictive index for objective estimates of mortality in acute lung injury
- PMID: 19384214
- PMCID: PMC2731230
- DOI: 10.1097/CCM.0b013e3181a009b4
A simple clinical predictive index for objective estimates of mortality in acute lung injury
Abstract
Objective: We sought to develop a simple point score that would accurately capture the risk of hospital death for patients with acute lung injury (ALI).
Design: This is a secondary analysis of data from two randomized trials. Baseline clinical variables collected within 24 hours of enrollment were modeled as predictors of hospital mortality using logistic regression and bootstrap resampling to arrive at a parsimonious model. We constructed a point score based on regression coefficients.
Setting: Medical centers participating in the Acute Respiratory Distress Syndrome Clinical Trials Network (ARDSnet).
Patients: Model development: 414 patients with nontraumatic ALI participating in the low tidal volume arm of the ARDSnet Acute Respiratory Management in ARDS study. Model validation: 459 patients participating in the ARDSnet Assessment of Low tidal Volume and elevated End-expiratory volume to Obviate Lung Injury study. Model Validation: 459 patients participating in the ARDSnet Assessment of Low tidal Volume and elevated End-expiratory volume to Obviate Lung Injury trial.
Interventions: None.
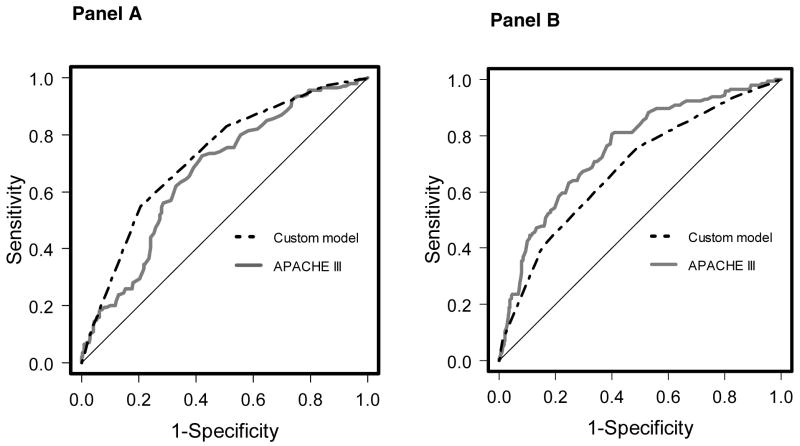
Measurements and main results: Variables comprising the prognostic model were hematocrit <26% (1 point), bilirubin >or=2 mg/dL (1 point), fluid balance >2.5 L positive (1 point), and age (1 point for age 40-64 years, 2 points for age >or=65 years). Predicted mortality (95% confidence interval) for 0, 1, 2, 3, and 4+ point totals was 8% (5% to 14%), 17% (12% to 23%), 31% (26% to 37%), 51% (43% to 58%), and 70% (58% to 80%), respectively. There was an excellent agreement between predicted and observed mortality in the validation cohort. Observed mortality for 0, 1, 2, 3, and 4+ point totals in the validation cohort was 12%, 16%, 28%, 47%, and 67%, respectively. Compared with the Acute Physiology Assessment and Chronic Health Evaluation III score, areas under the receiver operating characteristic curve for the point score were greater in the development cohort (0.72 vs. 0.67, p = 0.09) and lower in the validation cohort (0.68 vs. 0.75, p = 0.03).
Conclusions: Mortality in patients with ALI can be predicted using an index of four readily available clinical variables with good calibration. This index may help inform prognostic discussions, but validation in nonclinical trial populations is necessary before widespread use.
Conflict of interest statement
Figures


Comment in
-
Acute respiratory distress syndrome mortality--easier to predict, still hard to be certain.Crit Care Med. 2009 Jun;37(6):2110-1. doi: 10.1097/CCM.0b013e3181a5e673. Crit Care Med. 2009. PMID: 19448459 No abstract available.
References
-
- Herridge MS, Cheung AM, Tansey CM, et al. One-year outcomes in survivors of the acute respiratory distress syndrome. N Engl J Med. 2003;348:683–693. - PubMed
-
- Rubenfeld GD, Herridge MS. Epidemiology and outcomes of acute lung injury. Chest. 2007;131:554–562. - PubMed
-
- Prendergast TJ, Claessens MT, Luce JM. A national survey of end-of-life care for critically ill patients. Am J Respir Crit Care Med. 1998;158:1163–1167. - PubMed
-
- Cook D, Rocker G, Marshall J, et al. Withdrawal of mechanical ventilation in anticipation of death in the intensive care unit. N Engl J Med. 2003;349:1123–1132. - PubMed
-
- Stapleton RD, Wang BM, Hudson LD, et al. Causes and timing of death in patients with ARDS. Chest. 2005;128:525–532. - PubMed
Publication types
MeSH terms
Grants and funding
LinkOut - more resources
Full Text Sources
