. 2009 Jun;46(2):382-93.
doi: 10.1016/j.neuroimage.2009.01.030.

Target-specific contrast agents for magnetic resonance microscopy

Affiliations

Target-specific contrast agents for magnetic resonance microscopy

Megan L Blackwell et al. Neuroimage. 2009 Jun.

Abstract

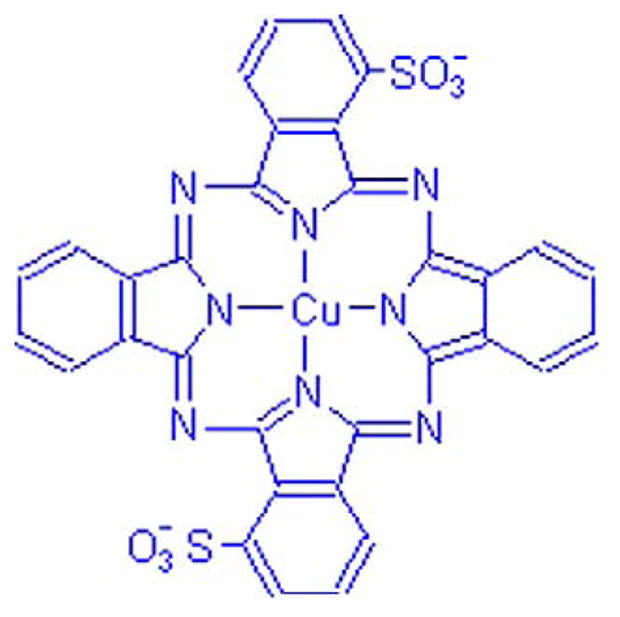
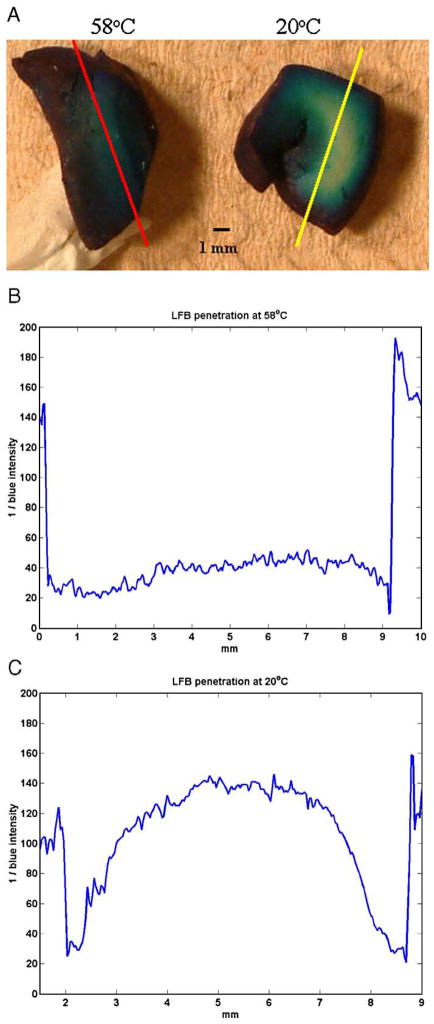
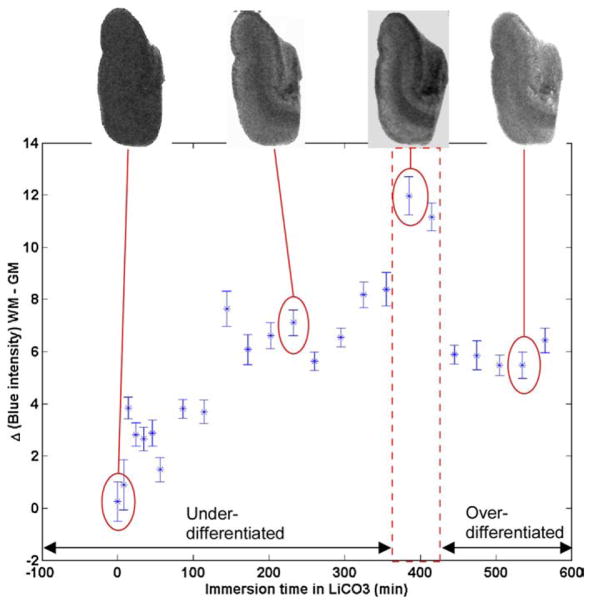
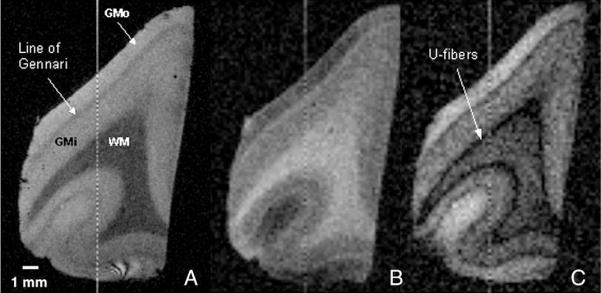
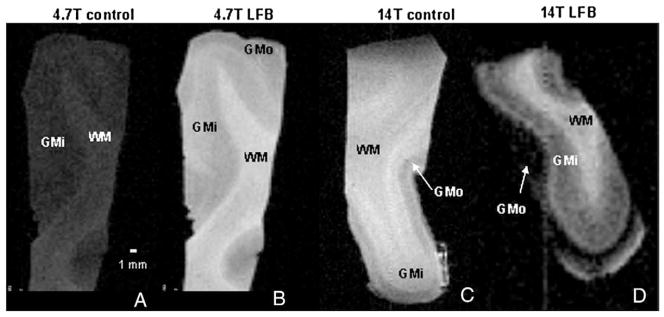
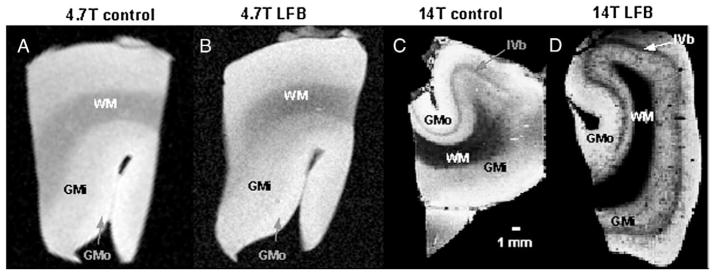
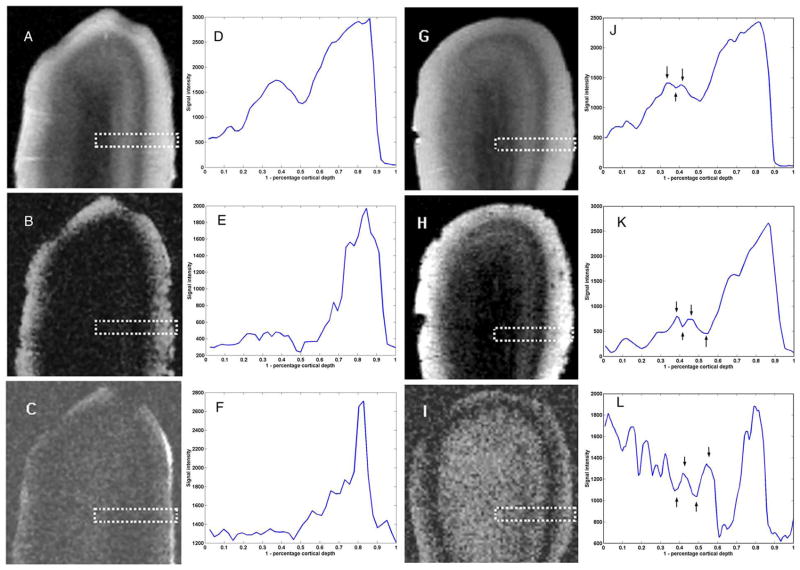
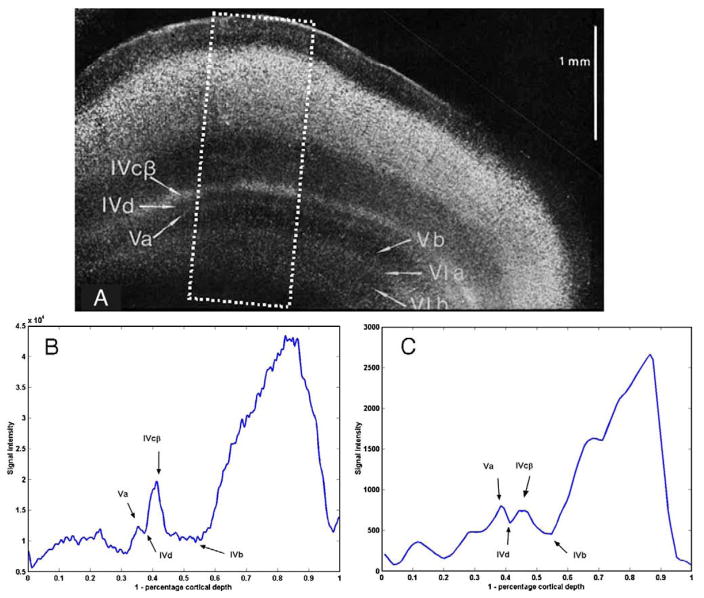
High-resolution ex vivo magnetic resonance (MR) imaging can be used to delineate prominent architectonic features in the human brain, but increased contrast is required to visualize more subtle distinctions. To aid MR sensitivity to cell density and myelination, we have begun the development of target-specific paramagnetic contrast agents. This work details the first application of luxol fast blue (LFB), an optical stain for myelin, as a white matter-selective MR contrast agent for human ex vivo brain tissue. Formalin-fixed human visual cortex was imaged with an isotropic resolution between 80 and 150 microm at 4.7 and 14 T before and after en bloc staining with LFB. Longitudinal (R1) and transverse (R2) relaxation rates in LFB-stained tissue increased proportionally with myelination at both field strengths. Changes in R1 resulted in larger contrast-to-noise ratios (CNR), per unit time, on T1-weighted images between more myelinated cortical layers (IV-VI) and adjacent, superficial layers (I-III) at both field strengths. Specifically, CNR for LFB-treated samples increased by 229 +/- 13% at 4.7 T and 269 +/- 25% at 14 T when compared to controls. Also, additional cortical layers (IVca, IVd, and Va) were resolvable in 14 T-MR images of LFB-treated samples but not in control samples. After imaging, samples were sliced in 40-micron sections, mounted, and photographed. Both the macroscopic and microscopic distributions of LFB were found to mimic those of traditional histological preparations. Our results suggest target-specific contrast agents will enable more detailed MR images with applications in imaging pathological ex vivo samples and constructing better MR atlases from ex vivo brains.


Figures

Fig. 1
Fig. 1
Chemical structure of luxol fast blue (LFB), an amine salt of a sulphonated copper phthalocyanine (Horobin, 2002). Arrows represent dative bonds between copper and nitrogen atoms.
Fig. 2
Fig. 2
(A) Two representative samples of human brain tissue, immersed in luxol fast blue (LFB) at either 56 °C (left) or 22 °C (right) for 24 h and then bisected. Plotted below for each sample is the reciprocal of the blue intensity along a path perpendicular to the surface. LFB was found to have a penetration rate of 1.4 mm per day at the warmer temperature (B), compared to 0.5 mm per day at the cooler temperature (C).
Fig. 3
Fig. 3
Samples of LFB-stained human brain tissue were immersed in a 0.05% aqueous solution of lithium carbonate (LiCO) for intervals ranging between 0 and 520 min, blotted, and photographed. Plotted above is the blue intensity difference between white matter (WM) and gray matter (GM) as a function of immersion time. Representative images appear for four time points. (For interpretation of the references to colour in this figure legend, the reader is referred to the web version of this article.)
Fig. 4
Fig. 4
MR images with T2-weighting (A), T1-weighting (B), and intermediate weighting at 14 T of an LFB-stained, LiCO-differentiated sample of human visual cortex. Three regions of interest used for analysis are clearly visible in all images: white matter (WM), inner gray matter (GMi), comprised of layers IVc–VI, and outer gray matter (GMo), comprised of layers I–IVa. The Line of Gennari, layer IVb that is heavily myelinated in visual cortex, is also prominently displayed. In image C, the subarcuate fibers, or “u-fibers,” are also resolvable and appear darker than the underlying white matter. Images have 150-micron isotropic resolution and were acquired using (A) a gradient echo sequence (TR/TE=80/15.2 ms, Θ=30°); (B) an inversion-prepared spin echo sequence (TR/TE/TI=5000/5.96/320 ms); and (C) an inversion-prepared spin echo sequence (TR/TE/TI=5000/5.96/120 ms).
Fig. 5
Fig. 5
Comparison of relaxation rates in white matter (WM), inner gray matter (GMi), and outer gray matter (GMo) for three differing preparations of fixed human tissue samples: 1) formalin alone, 2) 95% ethanol immersion and 0.05% lithium carbonate differentiation, or 3) LFB immersion and 0.05% lithium carbonate differentiation. (A) At 14 T, R1 increased significantly (p<0.05) for all ROIs (WM, GMi, and GMo) for all comparisons (formalin–EtOH, formalin–LFB, and EtOH–LFB). (B) At 14 T, R2 increased significantly for all ROIs and all comparisons except GMo between formalin and EtOH preparations. (C) At 4.7 T, R1 increased significantly for all ROIs and all comparisons. (D) At 4.7 T, R2 increased significantly for all ROIs and all comparisons except GMi and GMo between EtOH and LFB preparations.
Fig. 6
Fig. 6
T1-weighted MR images of tissues “stained” with ethanol and differentiated with lithium carbonate (A,C) exhibit less contrast between adjacent laminar regions, white matter (WM), inner gray matter (GMi), and outer gray matter (GMo) than samples stained with LFB and differentiated with lithium carbonate (B,D). Images were acquired with 150-micron isotropic resolution using an inversion-prepared spin echo sequence with the following parameters (in ms): TR/TI=800/380.2 (A); 1000/167.4 (B); 3800/749.1 (C); 3500/636.6 (D). Samples A and B were imaged at 4.7 T, samples C and D at 14 T. Eight averages were performed for each scan.
Fig. 7
Fig. 7
T2-weighted MR images of control tissues treated with formalin only (A, C) compared to tissues stained with LFB and differentiated with lithium carbonate (B, D). Samples A and B were imaged at 4.7 T, samples C and D at 14 T. White matter (WM) and inner gray matter (GMi) appear darker in LFB-treated samples, which, at 4.7 T, enhances the transition between GMi and outer gray matter (GMo) but blurs the WM-GMi boundary. In addition, at 14 T, the GMi in the LFB sample has a stippled appearance, presumably due to compartmental susceptibility effects caused by accumulation of contrast agent along radial fibers. Images were acquired with 150-μm isotropic resolution using a spin echo sequence, choosing the following parameters: TR(ms)/TE(ms)/Θ: 60/22.5/45° (A); 60/17/45° (B); 100/12.3/20° (C); 100/10.6/20° (D) Eight averages were performed for each scan.
Fig. 8
Fig. 8
Three separate, 80-micron isotropic resolution MR acquisitions at 14 T of ethanol control samples (A–C) and LFB-stained preparations (G–I). Images A and G are spin-echo acquisitions (TR/TE=2000/20.5 ms, NEX=8), images B and H, gradient-echo acquisitions (TR/TE=200/22.7 ms, Θ=30°, NEX=8), and images C and I, inversion-prepared spin echo acquisitions (TR/TE/TI=5000/7.2/300 ms, NEX=8). (D–F, J–L) Averages of signal intensity along 12 profiles perpendicular to the cortical surface were calculated in the region illustrated by the dotted rectangle and are plotted to the right of each image. Additional lamina that become resolvable in the LFB preparations are highlighted with arrows (J–L).
Fig. 9
Fig. 9
(A) An inverted light microscope image (Fig. 5, Plate 2 from Braak, 1976) of an 800 micron-thick slab of Astrablau-stained human visual cortex. (B) Average signal intensity along 120 profiles perpendicular to the cortical surface were calculated in the dotted rectangular region shown in (A). Arrows have been added to label the peaks and troughs corresponding to the documented lamina (layers IVb, IVcβ, IVd, and Va) in (A). (C) Fig. 8E is repeated here for comparison: Average of signal intensity along 12 profiles perpendicular to the cortical surface calculated for the rectangular area shown in Fig. 8B.
Fig. 10
Fig. 10
Distribution of LFB among myelinated fibers for en bloc staining mimics that of traditional histologic preparation. (A) Gradient echo acquisition (TR/TE=60/7.7 ms Θ=30°) at 14T; 80-micron isotropic resolution. (B) Infrared image obtained to aid alignment of MR and histological images; 21-micron in-plane resolution. Dotted squares in (A) and (B) indicate the approximate location of the 40-micron thick, 2× magnification slice preparation in (C), to which no additional stain has been added. The macroscopic LFB distribution is proportional to myelination and is concentrated in white matter and the line of Gennari, causing these areas to have a darker intensity in light microscopy. Illustrated in (C) are three additional regions of interest: (D) 10× magnification of subcortical white matter; (E) 40× magnification of inner gray matter (GMi) reveals radial fibers (arrows) retaining LFB stain; (F) 40× magnification closer to layer IVb showing tangential fibers (arrows) that retaining LFB stain.

References

    1. Annese J, Pitiot A, Dinov ID, Toga AW. A myelo-architectonic method for the structural classification of cortical areas. Neuroimage. 2004;21 (1):15–26. - PubMed
    1. Augustinack JC, van der Kouwe AJ, Blackwell ML, Salat DH, Wiggins CJ, Frosch MP, Wiggins GC, Potthast A, Wald LL, Fischl BR. Detection of entorhinal layer II using 7Tesla magnetic resonance imaging. Ann Neurol. 2005;57:489–494. - PMC - PubMed
    1. Barbier EL, Marrett S, Danek A, Vortmeyer A, van Gelderen P, Duyn J, Bandettini P, Grafman J, Koretsky AP. Imaging cortical anatomy by high-resolution MR at 3.0 T: detection of the stripe of Gennari in visual area 17. Magn Reson Med. 2002;48:735–738. - PubMed
    1. Benveniste H, Einstein G, Kim KR, Hulette C, Johnson GA. Detection of neuritic plaques in Alzheimer’s disease by magnetic resonance microscopy. Proc Natl Acad Sci U S A. 1999;96:14079–14084. - PMC - PubMed
    1. Blamire AM, Rowe JG, Styles P, McDonald B. Optimising imaging parameters for post mortem MR imaging of the human brain. Acta Radiol. 1999;40:593–597. - PubMed

Publication types

MeSH terms