

Improvements to the percolator algorithm for Peptide identification from shotgun proteomics data sets
- PMID: 19385687
- PMCID: PMC2710313
- DOI: 10.1021/pr801109k
Improvements to the percolator algorithm for Peptide identification from shotgun proteomics data sets
Abstract
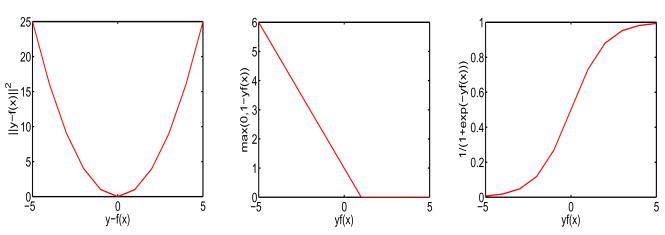
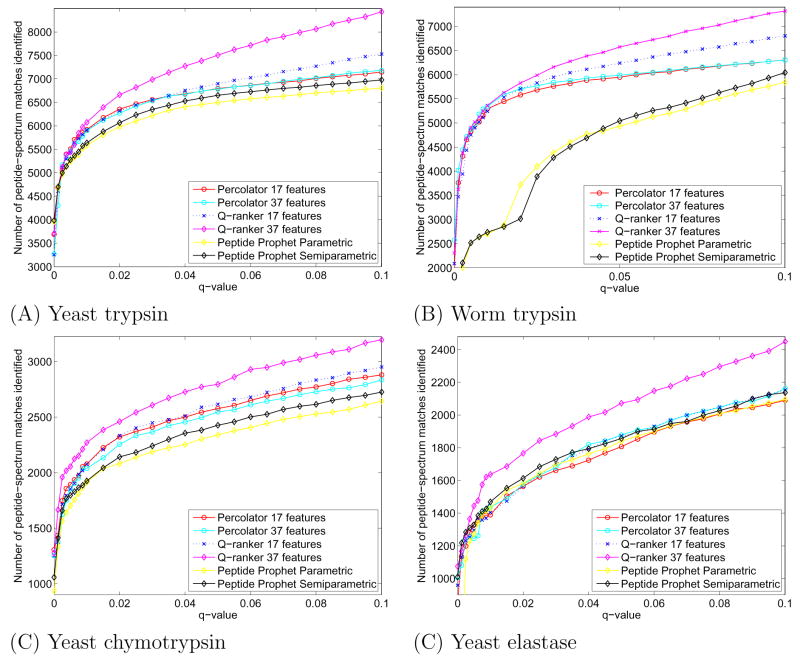
Shotgun proteomics coupled with database search software allows the identification of a large number of peptides in a single experiment. However, some existing search algorithms, such as SEQUEST, use score functions that are designed primarily to identify the best peptide for a given spectrum. Consequently, when comparing identifications across spectra, the SEQUEST score function Xcorr fails to discriminate accurately between correct and incorrect peptide identifications. Several machine learning methods have been proposed to address the resulting classification task of distinguishing between correct and incorrect peptide-spectrum matches (PSMs). A recent example is Percolator, which uses semisupervised learning and a decoy database search strategy to learn to distinguish between correct and incorrect PSMs identified by a database search algorithm. The current work describes three improvements to Percolator. (1) Percolator's heuristic optimization is replaced with a clear objective function, with intuitive reasons behind its choice. (2) Tractable nonlinear models are used instead of linear models, leading to improved accuracy over the original Percolator. (3) A method, Q-ranker, for directly optimizing the number of identified spectra at a specified q value is proposed, which achieves further gains.
Figures


References
-
- Anderson DC, Li W, Payan DG, Noble WS. A new algorithm for the evaluation of shotgun peptide sequencing in proteomics: support vector machine classification of peptide MS/MS spectra and sequest scores. Journal of Proteome Research. 2003;2(2):137–146. - PubMed
-
- Benjamini Y, Hochberg Y. Controlling the false discovery rate: a practical and powerful approach to multiple testing. Journal of the Royal Statistical Society B. 1995;57:289–300.
-
- Choi H, Ghosh D, Nesvizhskii A. Statistical validation of peptide identifications in large-scale proteomics using target-decoy database search strategy and flexible mixture modeling. Journal of Proteome Research. 2008;7(1):286–292. - PubMed
-
- Choi H, Nesvizhskii AI. Semisupervised model-based validation of peptide identifications in mass spectrometry-based proteomics. Journal of Proteome Research. 2008;7(1):254–265. - PubMed
Publication types
MeSH terms
Substances
Grants and funding
LinkOut - more resources
Full Text Sources
Other Literature Sources
Molecular Biology Databases
