. 2009 Apr 21;7(4):e1000090.
doi: 10.1371/journal.pbio.1000090.

Target genes of the MADS transcription factor SEPALLATA3: integration of developmental and hormonal pathways in the Arabidopsis flower

Affiliations

Target genes of the MADS transcription factor SEPALLATA3: integration of developmental and hormonal pathways in the Arabidopsis flower

Kerstin Kaufmann et al. PLoS Biol. .

Abstract

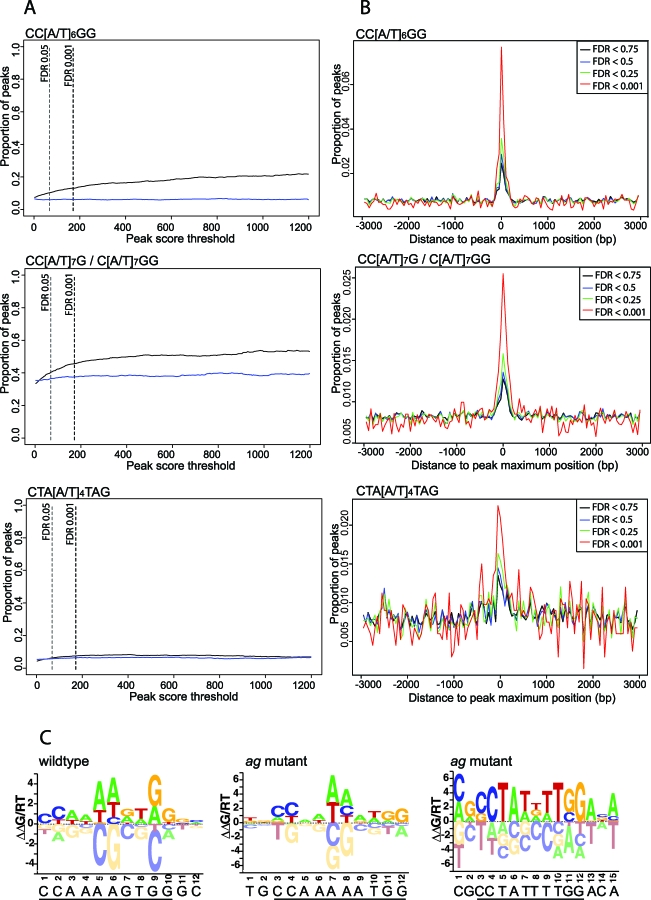
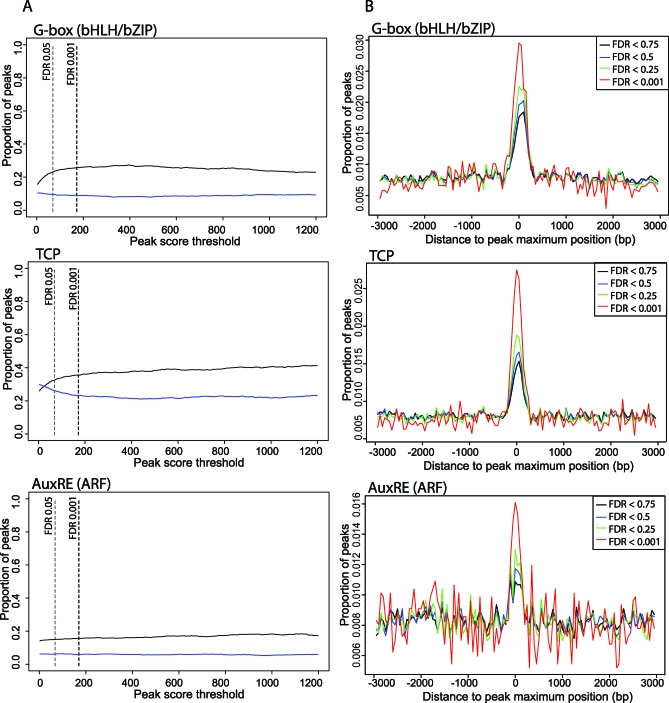
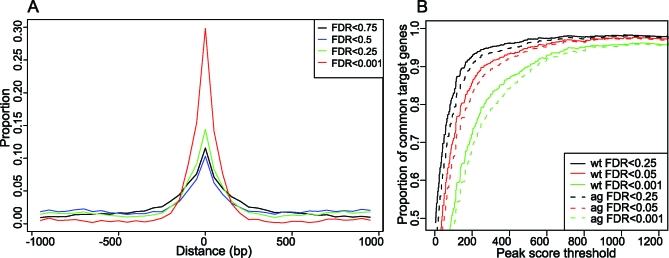
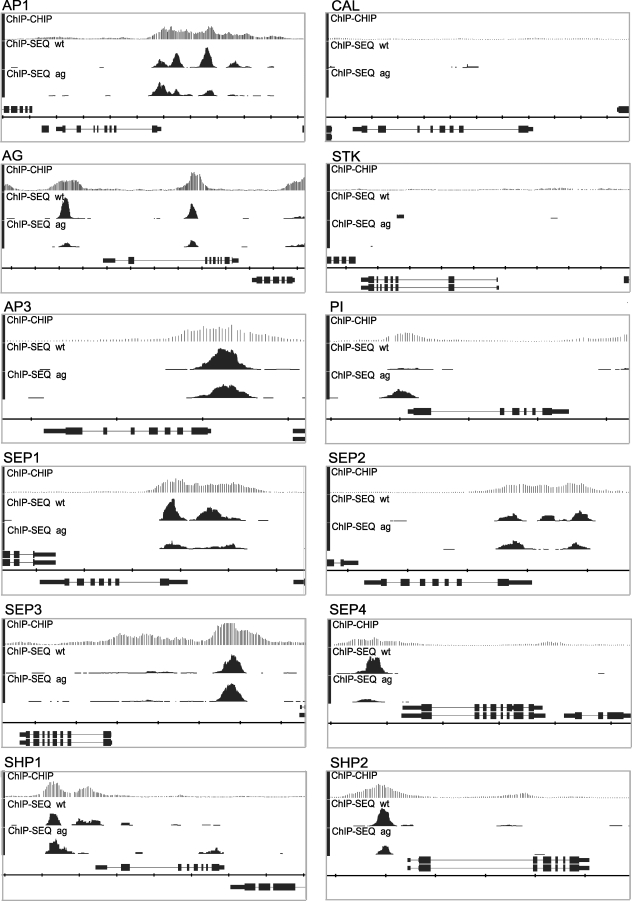
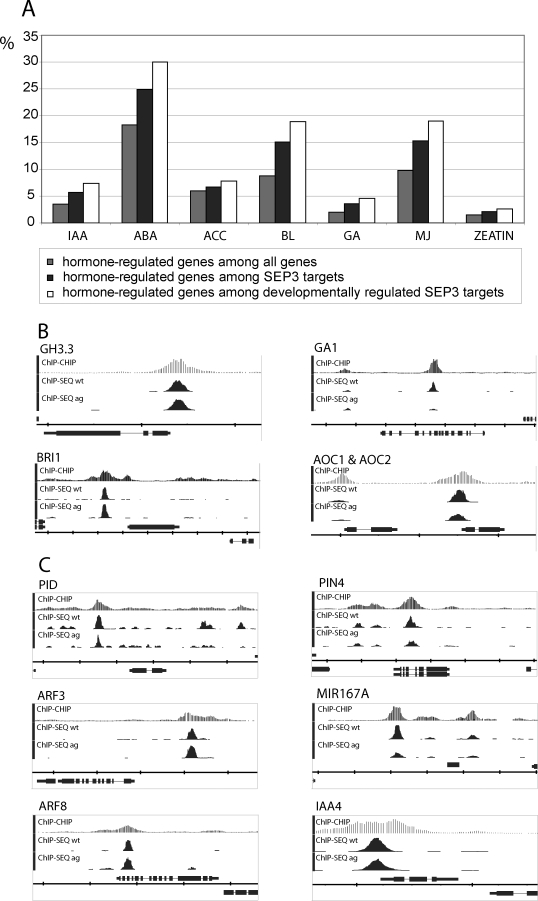
The molecular mechanisms by which floral homeotic genes act as major developmental switches to specify the identity of floral organs are still largely unknown. Floral homeotic genes encode transcription factors of the MADS-box family, which are supposed to assemble in a combinatorial fashion into organ-specific multimeric protein complexes. Major mediators of protein interactions are MADS-domain proteins of the SEPALLATA subfamily, which play a crucial role in the development of all types of floral organs. In order to characterize the roles of the SEPALLATA3 transcription factor complexes at the molecular level, we analyzed genome-wide the direct targets of SEPALLATA3. We used chromatin immunoprecipitation followed by ultrahigh-throughput sequencing or hybridization to whole-genome tiling arrays to obtain genome-wide DNA-binding patterns of SEPALLATA3. The results demonstrate that SEPALLATA3 binds to thousands of sites in the genome. Most potential target sites that were strongly bound in wild-type inflorescences are also bound in the floral homeotic agamous mutant, which displays only the perianth organs, sepals, and petals. Characterization of the target genes shows that SEPALLATA3 integrates and modulates different growth-related and hormonal pathways in a combinatorial fashion with other MADS-box proteins and possibly with non-MADS transcription factors. In particular, the results suggest multiple links between SEPALLATA3 and auxin signaling pathways. Our gene expression analyses link the genomic binding site data with the phenotype of plants expressing a dominant repressor version of SEPALLATA3, suggesting that it modulates auxin response to facilitate floral organ outgrowth and morphogenesis. Furthermore, the binding of the SEPALLATA3 protein to cis-regulatory elements of other MADS-box genes and expression analyses reveal that this protein is a key component in the regulatory transcriptional network underlying the formation of floral organs.


Conflict of interest statement

Competing interests. The authors have declared that no competing interests exist.

Figures

Figure 1
Figure 1. Enrichment, Position, and Sequences of CArG Boxes in ChIP-SEQ Peaks
(A) Enrichment of CArG boxes in peak areas with increasing significance threshold. All different types of CArG boxes show an increase in frequency with increasing significance level. Note that the frequency of the MEF2-type CArG box increases only very weakly enriched. Black line: proportion of peaks with at least one binding site. Blue line: proportion of peaks with at least one binding site after permutating the nucleotide positions of the peak areas, keeping the same base composition (i.e., control). (B) Frequency plots of sequence position of CArG boxes relative to the peak score maximum position (“center of the peak”). Only perfect CArG boxes were considered in the analyses (no mismatches allowed). All three types of CArG boxes show enrichment in the center of the peak, with the canonical SRF motif CC[A/T]6GG displaying the strongest enrichment in the peak maximum score position. (C) Affinity logos of CArG box–like elements identified by MatrixREDUCE [30]. The logo represents the estimated DNA-binding affinity (ΔΔG) for each nucleotide position. One consensus motif resembling a CArG box was identified for the wild-type ChIP-SEQ data, whereas two motifs were found in the ag mutant data.
Figure 2
Figure 2. Preferred Distances between CArG Boxes within ChIP-SEQ Peaks
Plotted are the −loge(p-value) resulting from a binomial test for enrichment of distances of CArG boxes in wild-type ChIP-SEQ data compared to a random set of promoters (promoter control) and randomized sequences (random control). The Bonferroni correction gives the most conservative cutoff for significantly enriched distances. The most strongly preferred distance is at 42–43 bp.
Figure 3
Figure 3. Non–MADS-DNA Binding Motifs Enriched in ChIP-SEQ Peaks
(A) Increase in frequency of the motifs with increasing significance level (peak score threshold). Black line: proportion of peaks with at least one binding site; blue line: proportion of peaks with at least one binding site after permutating the nucleotide positions of the peak areas, keeping the same base composition (i.e., control). (B) Frequency plots of sequence position of TCP, bHLH/bZIP, and ARF binding sites relative to the peak score maximum position (“center of the peak”) (no mismatches allowed). All sequence elements show enrichment in the center of the peak.
Figure 4
Figure 4. Distance between Peaks in Wild Type and agamous Mutant and Overlapping Target Genes
(A) Proportion of distances between significant peaks in wild type and ag mutant for different FDR levels. Most peaks cluster within a distance of ±200 bp. (B) Proportion of common target genes for wild-type and ag mutant datasets. The solid line represents the proportion of common targets genes relative to the total number of targets in the ag mutant for different FDR levels of the wild-type dataset; the dashed line represents the proportion of common target genes relative to the total number of targets in the wild-type for different FDR levels of the ag mutant dataset. Since the total number of significant peaks is lower in ag mutant than in the wild-type dataset, the dashed line is below the solid line.
Figure 5
Figure 5. Binding Profiles of Floral Homeotic MADS-Box Gene Loci
For each locus, ChIP-CHIP and ChIP-SEQ profiles are depicted for SEP3 in wild type (wt) and in the ag mutant. The TAIR annotation of the genomic loci is shown at the bottom of each panel. If the genomic locus is shown above the scale, it is in forward orientation, and if it is in the bottom of the scale, it is in reverse orientation. The scale division corresponds to 1,000 nt. In most cases, the enrichment is in the upstream regions of the respective genes.
Figure 6
Figure 6. Differential Expression of SEP3 Targets of the MADS-Box Gene Family after SEP3 Induction
SEP3 expression was induced in seedlings for 8 h, 1 d, or 10 d, and the change in expression of selected MADS-box genes relative to noninduced seedlings was determined by quantitative RT-PCR. The standard error represents the variation between two independent biological and technical replicates. All of the depicted genes, with the exception of CAL and STK, are bound by SEP3 (see Figure 5). In line with being indirect targets, these two genes are only up-regulated 10 d after SEP3 induction.
Figure 7
Figure 7. Enrichment for GO Terms in the Category “Biological Process”
The five most strongly enriched GO terms of the lowest possible level (minimum 20 annotated loci) in the GO hierarchy are presented. The GO term “localization” is shown as an example for a nonenriched category.
Figure 8
Figure 8. Hormonal Signaling Targeted by SEP3
(A) Characterization of hormone-regulated genes among SEP3 targets. The fraction of hormone-regulated genes among all genes represented on the ATH1 microarray is given (grey box), as well as the fraction of hormone-regulated genes among SEP3 targets (black box) and the fraction of hormone-regulated genes among SEP3 targets that are differentially expressed during reproductive development (white box). Hormone-regulated targets are overrepresented among SEP3 targets, with the strongest overrepresentation for IAA-, BL-, and GA-regulated genes (enrichment >1.6-fold among all SEP3 targets and >2.1-fold among developmentally regulated targets). Data on hormone-responsive genes (low stringency) were taken from [42]. Developmentally regulated SEP3 target genes were the ones identified using the AtGenExpress microarray datasets (Figure S5). ABA, abscisic acid; ACC, ethlyene; BL, brassinolide; GA, gibberellic acid; IAA, indole acetic acid; MJ, methyl jasmonate. (B) Representative key regulatory enzymes and hormonal signaling genes among the top 200 most strongly enriched targets of SEP3. GH3.3 encodes an IAA-amido synthase that is involved in auxin homeostasis [78]. GA1 encodes a key enzyme in giberellic acid biosynthesis [79]. BRI1 encodes a receptor kinase mediating brassinosteroid signal transduction [80]. AOC1 and AOC2 gene products catalyze an essential step in jasmonic acid biosynthesis [81]. (C) Different steps in the auxin signaling pathway targeted by SEP3. PID (kinase) and PIN4 (auxin efflux carrier) are important for auxin transport [47,82]. ARF3 (ETT) and ARF8 are members of the auxin response factor (ARF) family of transcription factors [49,83]. MIR167A is one of the genomic loci encoding for a miRNA targeting ARF6 and ARF8 [84]. IAA4 is an auxin-induced gene [85]; its gene product possibly acts as antagonist of ARF transcription factors. In (B) and (C), the TAIR annotation of the genomic loci is shown at the bottom of each panel. If the genomic locus is shown above the scale, it is in forward orientation, and if it is in the bottom of the scale, it is in reverse orientation. The scale division corresponds to 2,000 nt. wt, wild type.
Figure 9
Figure 9. Role of SEP3 in Auxin Signaling
(A) Wild-type Arabidopsis flower. (B) ett mutant flower, two sepals and petals removed. (C and D) Flowers of SEP3-EAR plants (pSEP3::SEP3-EAR in sep3–1 mutant) with strong mutant phenotype, sepals (and filamentous organs in [D]) were removed to reveal the inner organs. (E) Inflorescence of SEP3-EAR plant. (F) Inflorescence of ett-1 mutant. (G) SEM picture of a flower from a SEP3-EAR plant revealing abnormal ovule placentation and enlarged stigmatic tissue (sepals were removed). (H and I) Localization of nuclear localized DR5::YFP (yellow) in a floral meristem (H). Localization of SEP3-GFP driven from its own promoter in a floral meristem (I). Arrows indicate similar localization of the DR5 marker and SEP3 in sepal tips. White bar indicates 30 μm. (J) Flower of a sep1 sep2/SEP2 sep3 mutant plant with stalked carpel. (K) pid mutant flower with stalked carpel. (L–N) Venation patterns in wild-type (L) and SEP3-EAR carpels (M) and (N).
Figure 10
Figure 10. Autoregulatory Network of MADS Box Transcription Factors in Arabidopsis Flower Development
The network was visualized using the BioTapestry program [55]. According to our results, SEP3 is involved in the direct repression of flowering time genes, as well as in the activation of floral homeotic genes by binding to their respective promoters. The regulation of PI by AP3 is not confirmed by experimental approaches so far and might be indirect (dashed line).

Similar articles

Cited by

References

    1. Coen E. Goethe and the ABC model of flower development. C R Acad Sci III. 2001;324:523–530. - PubMed
    1. Chuck G, Hake S. Regulation of developmental transitions. Curr Opin Plant Biol. 2005;8:67–70. - PubMed
    1. Theissen G, Becker A, Di Rosa A, Kanno A, Kim JT, et al. A short history of MADS-box genes in plants. Plant Mol Biol. 2000;42:115–149. - PubMed
    1. Ferrario S, Immink RG, Angenent GC. Conservation and diversity in flower land. Curr Opin Plant Biol. 2004;7:84–91. - PubMed
    1. International Human Genome Sequencing Consortium. Finishing the euchromatic sequence of the human genome. Nature. 2004;431:931–945. - PubMed

Publication types

MeSH terms