. 2009 Apr;29(8):1533-42.
doi: 10.1111/j.1460-9568.2009.06728.x.

Differential loss and preservation of glutamate receptor function in bipolar cells in the rd10 mouse model of retinitis pigmentosa

Affiliations

Differential loss and preservation of glutamate receptor function in bipolar cells in the rd10 mouse model of retinitis pigmentosa

Theresa Puthussery et al. Eur J Neurosci. 2009 Apr.

Abstract

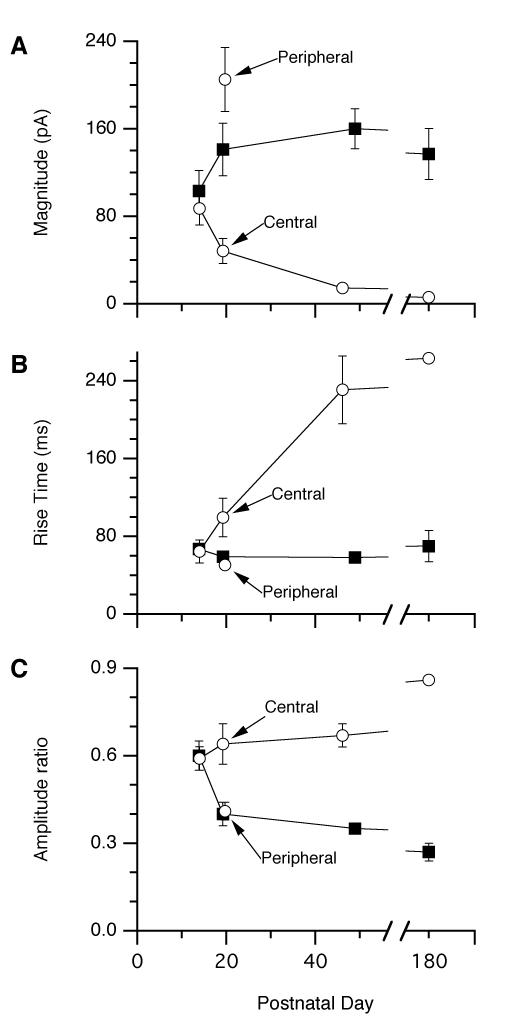
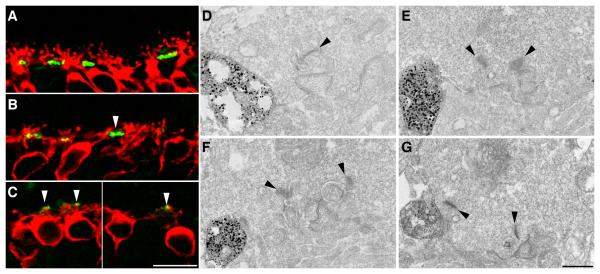
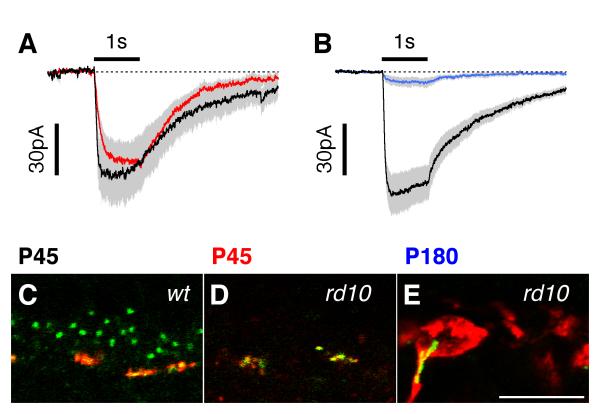
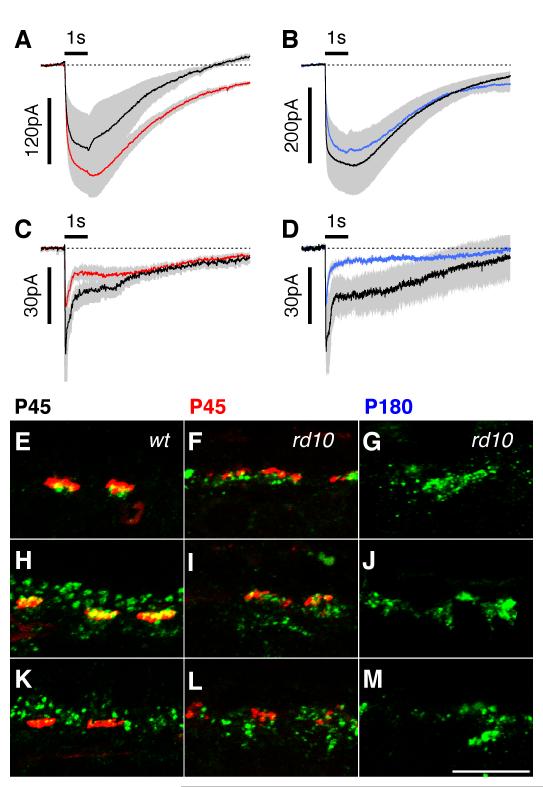
Photoreceptor degenerations can trigger morphological alterations in second-order neurons, however, the functional implications of such changes are not well known. We conducted a longitudinal study, using whole-cell patch-clamp, immunohistochemistry and electron microscopy to correlate physiological with anatomical changes in bipolar cells of the rd10 mouse - a model of autosomal recessive retinitis pigmentosa. Rod bipolar cells (RBCs) showed progressive changes in mGluR6-induced currents with advancing rod photoreceptor degeneration. Significant changes in response amplitude and kinetics were observed as early as postnatal day (P)20, and by P45 the response amplitudes were reduced by 91%, and then remained relatively stable until 6 months. These functional changes correlated with the loss of rod photoreceptors and mGluR6 receptor expression. Moreover, we showed that RBCs make transient ectopic connections with cones during progression of the disease. At P45, ON-cone bipolar cells (ON-CBCs) retain mGluR6 responses for longer periods than the RBCs, but by about 6 months these cells also strongly downregulate mGluR6 expression. We propose that the relative longevity of mGluR6 responses in CBCs is due to the slower loss of the cones. In contrast, ionotropic glutamate receptor expression and function in OFF-CBCs remains normal at 6 months despite the loss of synaptic input from cones. Thus, glutamate receptor expression is differentially regulated in bipolar cells, with the metabotropic receptors being absolutely dependent on synaptic input. These findings define the temporal window over which bipolar cells may be receptive to photoreceptor repair or replacement.


Figures

Figure 1
Figure 1
Agonist and light responses in wild-type rod bipolar cells. Holding potential in B-D is −70 mV. Duration of drug application is 1 sec. A. Fluorescence image of a typical RBC filled with Alexa-488 during a recording. B. Membrane current in response to a saturating 0.5 sec light flash in a RBC in a wt retina. C. Outward current elicited by puffing 1 mM glutamate onto the dendrites of a RBC in a bleached retinal slice. Note the suppression in membrane noise levels as the tonic mGluR6 current is reduced. D. Simulated light response in a wt RBC elicited by puffing 600 μM CPPG onto the dendrites in the presence of 4 μM APB. Middle panel: Simulated light response on an expanded time-scale showing the fit of a sigmoidal function to the rising phase, and an exponential function to the decay phase. Bottom panel: Simulated light response with 20 mM BAPTA in the recording electrode. The response is sustained and lacks the inactivation seen in the two panels above.
Figure 2
Figure 2
Function and localisation of the mGluR6 receptor in RBCs in wt and rd10 retinas at four developmental time points. Holding potential is −70 mV. Traces show averages for several cells with standard errors shown by grey shading. In panels A2-C2, exponential functions fitted to the decay phase are superimposed on the traces. In order to compare the time-courses of the responses, the amplitudes of traces in panels A2-C2 are normalized from the corresponding panels on the left. The immunohistochemical panels show vertical sections through the outer plexiform layer, with photoreceptors up. Vertical sections were labelled for mGluR6 (green) and the ribbon synapse marker, RIBEYE (red). Scale bar in all panels is 10 μm. P14: A1. Simulated light responses are characterized by a rapid increase to a peak followed by decay to a steady level. Responses are the average of 7 cells (wt, black lines) and 10 cells (rd10, red lines). A2. Normalized traces from A1 on an expanded time-scale, demonstrating that the kinetics of the responses in the two groups were essentially identical. The time-constants of the decay phases were 190 and 220 ms for the wt and rd10 traces respectively. A3, A4: mGluR6 puncta are closely associated with ribbon synapses in both the wt (A3) and rd10 (A4) retina. P20: Eccentricity dependent alterations in mGluR6 receptor function and localisation during peak rod apoptosis. B1. wt (black line, n=13) and rd10 simulated light responses. At less degenerated peripheral locations (rd10 red line, n=7) the response amplitudes were similar to control, while at more degenerated central regions (rd10 blue line, n=8) responses were smaller. B2: The superposition demonstrates that the kinetics of the rd10 responses in non-degenerated regions was similar to control, while responses in degenerated regions were more sustained. The time-constants of the exponential fits to the decay were (to the nearest 5 ms) 90, 125 and 385 ms for the wt, rd10 peripheral and rd10 central responses respectively. B3-5: There is a concomitant reduction in the number of ribbon synapses and mGluR6 receptor puncta in the rd10 retina, however, the residual mGluR6 receptor puncta remain associated with ribbon synapses. P45 & P180: Loss of mGluR6 receptor function and expression in RBCs in the late-stage rd10 retina. C1. Average simulated light responses from P45 wt (black, n=29), P45 rd10 (red, n=33), P180 wt (gray, n=6) and P180 rd10 (blue, n=6) retina. No measurable response was observed in 7 of the 33 rd10 cells from P45 and 2 of the 6 rd10 cells from P180. C2. The superposition demonstrates that the rd10 responses were slower to activate and much more sustained than the wt responses. The time-constant for the exponential fit to the decay phase (to the nearest 5 ms) was 100 ms C3,4: In the rd10 retina, residual mGluR6 expression is seen primarily in clusters at the inner aspect of the outer plexiform layer, a pattern consistent with expression on ON-cone bipolar cells.
Figure 3
Figure 3
Summary data showing changes to in the magnitude of the RBC responses (A), the 10-90% rise time (B) and ratio of the sustained to the peak response amplitude (C) as a function of postnatal age in wt (black squares) and rd10 (open circles) retinas. Parameters were measured separately for each cell and averaged together. The error bars show the standard-error of the mean. Due to the small sizes of the individual responses, the data points for the rd10 P180 data in A, B & C were obtained from analysis of the averaged response for all cells, as shown by the blue trace in Fig. 5C.
Figure 4
Figure 4
Rod bipolar cells send ectopic processes to cone pedicles in the rd10 retina. A-C: Confocal micrographs of vertical sections of the rd10 retina labelled for PKC (red) and PNA (green). Rod bipolar cell dendrites are not seen to make contacts at the base of the cone pedicles in the wild-type retina (A). At P20 (B), bipolar cell dendrites have lost their typical bushy appearance and show some straightened processes that appear to be targeted to cone pedicles (white arrowheads). By P45 (C), there is further loss of bipolar cell dendrites and the residual bipolar cell processes appear to be directed towards cone pedicles. D-G: Transmission electron micrographs of cone pedicles of the P20 rd10 retina after immunolabelling with PKC. PKC stained rod bipolar cell dendrites make contacts at the base of cone pedicles. Ribbon synapses are indicated with black arrowheads. Scale Bar A-C: 10 μm, D-G: 0.5 μm.
Figure 5
Figure 5
mGluR6 receptor function and localization in ON-cone bipolar cells. Holding potential is −70 mV. Traces show averages for several cells with standard errors shown by grey shading. A. At P45, prior to complete cone degeneration, wt (black, n=8) and rd10 (red, n=11) simulated light responses have similar amplitudes and time-courses. B. At P180, rd10 response amplitudes (blue, n=8) are markedly reduced compared to wt (black, n=9). C-E: Double labelling for mGluR6 (green) and the cone pedicle marker, peanut agglutinin (red). In the rd10 retina at P45 (D), all residual mGluR6 receptor puncta colocalise with the PNA stained cone pedicles (yellow), indicating that the remaining mGluR6 receptors are expressed by ON-cone bipolar cell dendrites. E: By P180, mGluR6 immunoreactivity (green) is completely lost from the OPL and is restricted to the soma and axons of rod bipolar cells (red). Scale Bar C-E = 10 μm.
Figure 6
Figure 6
Function and expression of ionotropic glutamate receptors in OFF bipolar cells. Holding potential is −70 mV. Traces show averages for several cells with standard errors shown by grey shading. A. At P45, responses to puff application of KA/AMPA have similar amplitudes and time-courses in wt (black, n=3 cells in one retina) and rd10 (red, n=4 cells in 2 retinas). B. Similarly, at P180, responses to KA/AMPA are indistinguishable in wt (black, n=4 cells in 2 retinas) and rd10 (blue, n=3 cells in 2 retinas) retinas. C,D: A second group of cells display more transient response kinetics under identical agonist application conditions. C: Average KA/AMPA responses in OFF-CBCs from P45 preparations; wt, black, n=4 cells in two retinas, and rd10, red, n=4 cells in two retinas. D Average KA/AMPA responses in OFF-CBCs from P180 preparations; wt, black, n=3 cells in two retinas, and rd10, blue, n=3 cells in two retinas. E-G. Double labelling of GluR1 (green) with PNA (red). In the wt retina (E), GluR1 is associated with cone pedicles and expression of GluR1 is seen at P45 (F) and P180 (G) in the rd10 retina. H-J. Double labelling of GluR2 (green) with PNA (red) in wt (H) and rd10 (I,J) retinas. K-M. Continued expression of GluR4 is seen at P45 and P180 in the rd10 retina. Scale Bar E-M = 10 μm.

Similar articles

Cited by

References

    1. Bainbridge JW, Tan MH, Ali RR. Gene therapy progress and prospects: the eye. Gene Ther. 2006;13:1191–1197. - PubMed
    1. Barhoum R, Martinez-Navarrete G, Corrochano S, Germain F, Fernandez-Sanchez L, de la Rosa EJ, de la Villa P, Cuenca N. Functional and structural modifications during retinal degeneration in the rd10 mouse. Neuroscience. 2008;155:698–713. - PubMed
    1. Berntson A, Taylor WR. Response characteristics and receptive field widths of on-bipolar cells in the mouse retina. J Physiol. 2000;524(Pt 3):879–889. - PMC - PubMed
    1. Berntson A, Smith RG, Taylor WR. Postsynaptic calcium feedback between rods and rod bipolar cells in the mouse retina. Vis Neurosci. 2004;21:913–924. - PubMed
    1. Blanks JC, Adinolfi AM, Lolley RN. Photoreceptor degeneration and synaptogenesis in retinal-degenerative (rd) mice. J Comp Neurol. 1974;156:95–106. - PubMed

Publication types

MeSH terms