

Masked volume wise Principal Component Analysis of small adrenocortical tumours in dynamic [11C]-metomidate Positron Emission Tomography
- PMID: 19386097
- PMCID: PMC2680831
- DOI: 10.1186/1471-2342-9-6
Masked volume wise Principal Component Analysis of small adrenocortical tumours in dynamic [11C]-metomidate Positron Emission Tomography
Abstract
Background: In previous clinical Positron Emission Tomography (PET) studies novel approaches for application of Principal Component Analysis (PCA) on dynamic PET images such as Masked Volume Wise PCA (MVW-PCA) have been introduced. MVW-PCA was shown to be a feasible multivariate analysis technique, which, without modeling assumptions, could extract and separate organs and tissues with different kinetic behaviors into different principal components (MVW-PCs) and improve the image quality.
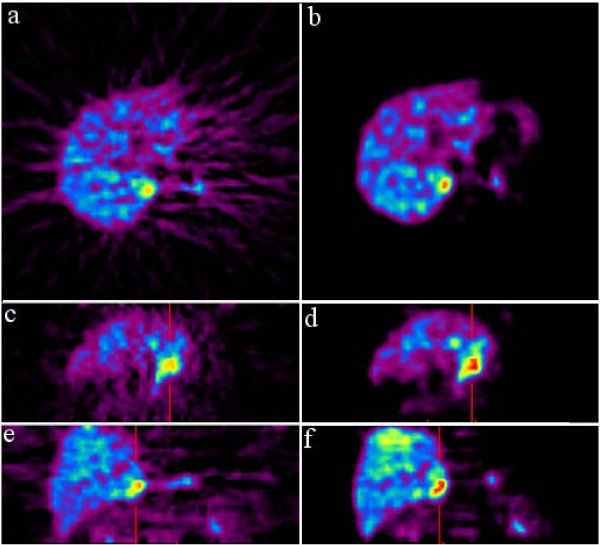
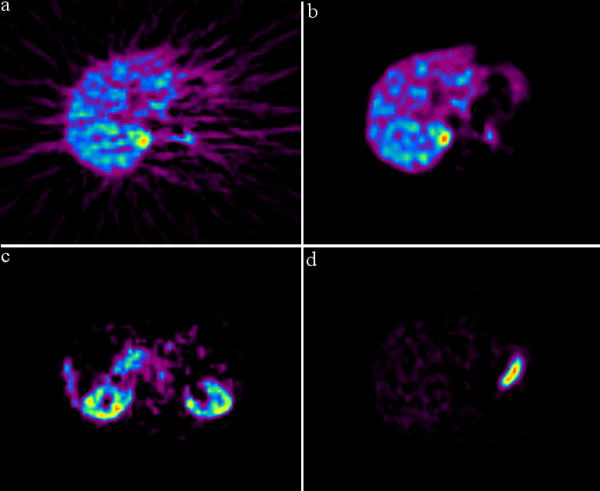
Methods: In this study, MVW-PCA was applied to 14 dynamic 11C-metomidate-PET (MTO-PET) examinations of 7 patients with small adrenocortical tumours. MTO-PET was performed before and 3 days after starting per oral cortisone treatment. The whole dataset, reconstructed by filtered back projection (FBP) 0-45 minutes after the tracer injection, was used to study the tracer pharmacokinetics.
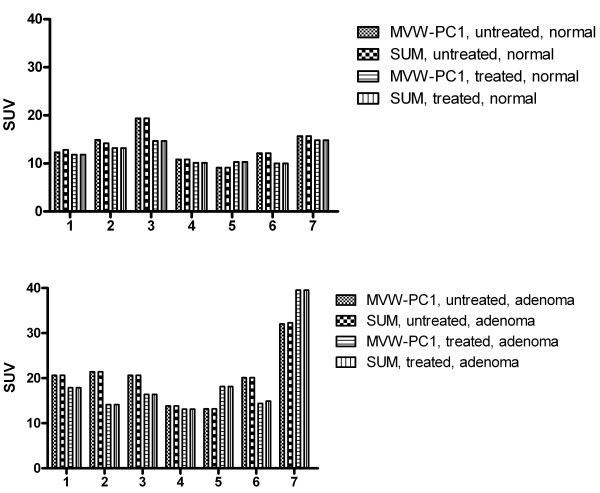
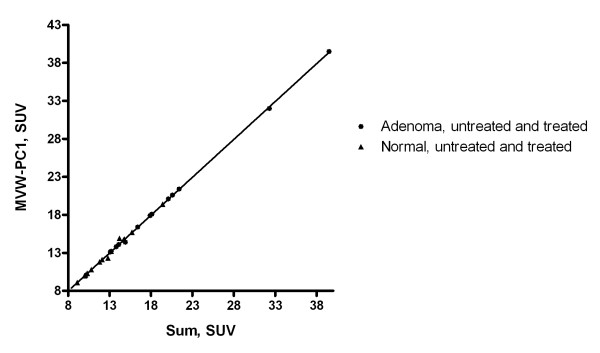
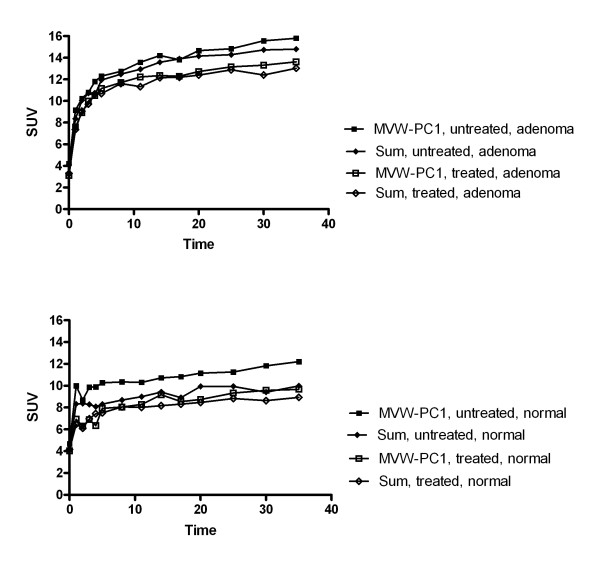
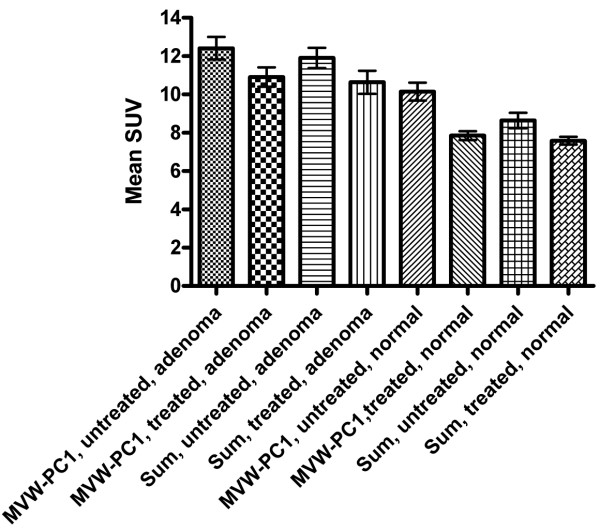
Results: Early, intermediate and late pharmacokinetic phases could be isolated in this manner. The MVW-PC1 images correlated well to the conventionally summed image data (15-45 minutes) but the image noise in the former was considerably lower. PET measurements performed by defining "hot spot" regions of interest (ROIs) comprising 4 contiguous pixels with the highest radioactivity concentration showed a trend towards higher SUVs when the ROIs were outlined in the MVW-PC1 component than in the summed images. Time activity curves derived from "50% cut-off" ROIs based on an isocontour function whereby the pixels with SUVs between 50 to 100% of the highest radioactivity concentration were delineated, showed a significant decrease of the SUVs in normal adrenal glands and in adrenocortical adenomas after cortisone treatment.
Conclusion: In addition to the clear decrease in image noise and the improved contrast between different structures with MVW-PCA, the results indicate that the definition of ROIs may be more accurate and precise in MVW-PC1 images than in conventional summed images. This might improve the precision of PET measurements, for instance in therapy monitoring as well as for delineation of the tumour in radiation therapy planning.
Figures
Similar articles
-
Masked-Volume-Wise PCA and "reference Logan" illustrate similar regional differences in kinetic behavior in human brain PET study using [11C]-PIB.BMC Neurol. 2009 Jan 7;9:2. doi: 10.1186/1471-2377-9-2. BMC Neurol. 2009. PMID: 19126243 Free PMC article.
-
Signal extraction and separation in in vivo animal PET studies with masked volumewise principal-component analysis.J Nucl Med Technol. 2010 Jun;38(2):53-60. doi: 10.2967/jnmt.110.075085. Epub 2010 May 18. J Nucl Med Technol. 2010. PMID: 20484179
-
[11C]metomidate positron emission tomography of adrenocortical tumors in correlation with histopathological findings.J Clin Endocrinol Metab. 2006 Apr;91(4):1410-4. doi: 10.1210/jc.2005-2273. Epub 2006 Jan 10. J Clin Endocrinol Metab. 2006. PMID: 16403816
-
1-(1-Phenylethyl)-1H-imidazole-5-carboxylic acid [11C]methyl ester.2005 Jun 10 [updated 2005 Jul 18]. In: Molecular Imaging and Contrast Agent Database (MICAD) [Internet]. Bethesda (MD): National Center for Biotechnology Information (US); 2004–2013. 2005 Jun 10 [updated 2005 Jul 18]. In: Molecular Imaging and Contrast Agent Database (MICAD) [Internet]. Bethesda (MD): National Center for Biotechnology Information (US); 2004–2013. PMID: 20641333 Free Books & Documents. Review.
-
Challenges in clinical studies with multiple imaging probes.Nucl Med Biol. 2007 Oct;34(7):879-85. doi: 10.1016/j.nucmedbio.2007.07.014. Nucl Med Biol. 2007. PMID: 17921038 Free PMC article. Review.
Cited by
-
Targeted Molecular Imaging in Adrenal Disease-An Emerging Role for Metomidate PET-CT.Diagnostics (Basel). 2016 Nov 18;6(4):42. doi: 10.3390/diagnostics6040042. Diagnostics (Basel). 2016. PMID: 27869719 Free PMC article. Review.
-
Imaging of adrenal masses with emphasis on adrenocortical tumors.Theranostics. 2012;2(5):516-22. doi: 10.7150/thno.3613. Epub 2012 May 17. Theranostics. 2012. PMID: 22737189 Free PMC article.
-
Metomidate-based imaging of adrenal masses.Horm Cancer. 2011 Dec;2(6):348-53. doi: 10.1007/s12672-011-0093-3. Horm Cancer. 2011. PMID: 22124841 Free PMC article. Review.
References
-
- Kloos R, Gross MD, Francis I, Korobkin M, Shapiro B. Incidentally discovered adrenal masses. Endocr Rev. 1995;16:460–484. - PubMed
-
- NIH state-of-the-science statement on management of the clinically inapparent adrenal mass ("incidentaloma") NIH Consens. State Sci Statements. 2002;19:25. - PubMed
-
- Grumbach M, Biller B, Braunstein G, Campbell K, Carney J, Godley P, Harris E, Lee J, Oertel Y, Posner M, Schlechte J, Wieand H. Management of the clinically inapparent adrenal mass ("incidentaloma") Ann Intern Med. 2003;138(5):424–429. - PubMed
MeSH terms
Substances
LinkOut - more resources
Full Text Sources
Other Literature Sources
Research Materials
Miscellaneous
