. 2009 Jul 3;284(27):18174-83.
doi: 10.1074/jbc.M109.001354. Epub 2009 Apr 22.

Meningioma 1 is required for appropriate osteoblast proliferation, motility, differentiation, and function

Affiliations

Meningioma 1 is required for appropriate osteoblast proliferation, motility, differentiation, and function

Xiaoxue Zhang et al. J Biol Chem. .

Abstract

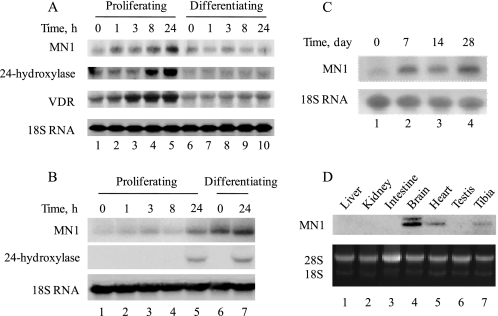
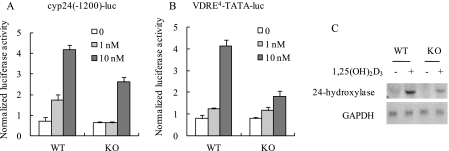
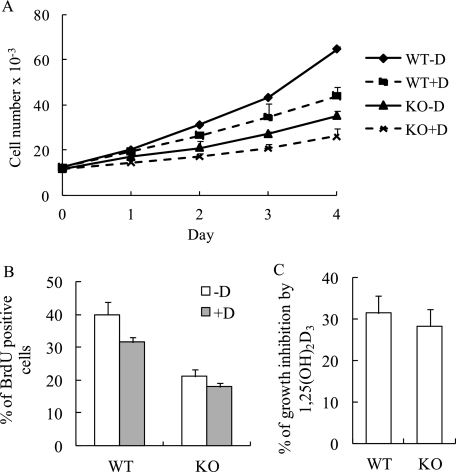
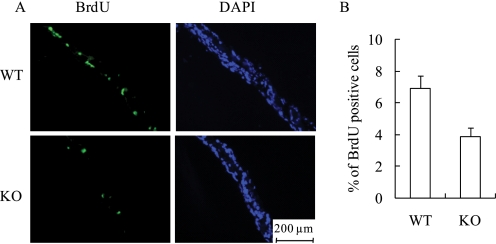
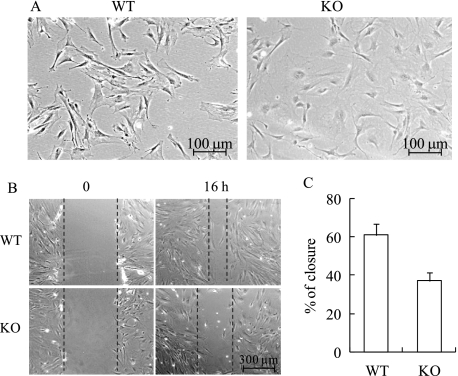
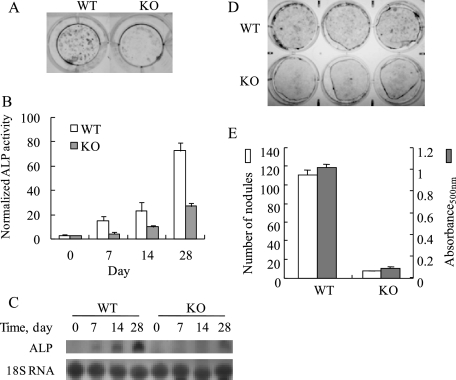
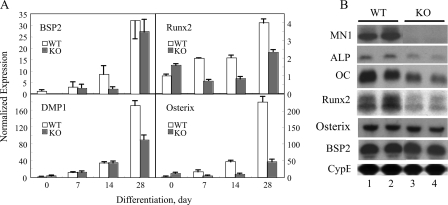
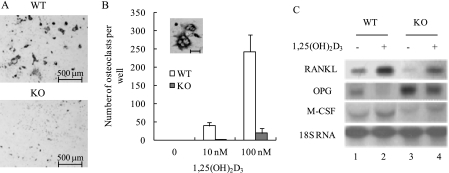
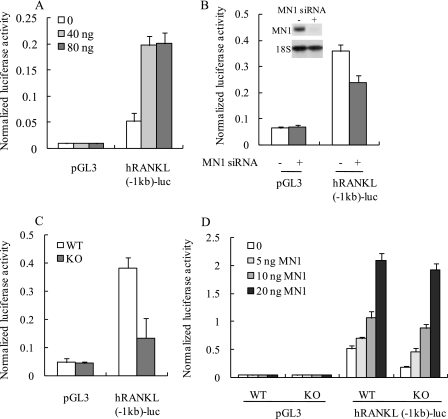
The vitamin D endocrine system is essential for calcium and phosphate homeostasis and skeletal mineralization. The 1,25-dihydroxyvitamin D(3) (1,25(OH)(2)D(3)) hormone binds to the vitamin D receptor (VDR) to regulate gene expression. These gene products in turn mediate the actions of 1,25(OH)(2)D(3) in mineral-regulating target cells such as the osteoblast. We showed previously that meningioma 1 (MN1) is a novel target of 1,25(OH)(2)D(3) in MG-63 osteoblastic cells and that it is a coactivator for VDR-mediated transcription (Sutton, A. L., Zhang, X., Ellison, T. I., and MacDonald, P. N. (2005) Mol. Endocrinol. 19, 2234-2244). However, the functional significance of MN1 in osteoblastic cell biology is largely unknown. Here, we demonstrate that MN1 expression is increased dramatically during differentiation of primary osteoblastic cells. Using calvarial osteoblasts derived from wild-type and MN1 knock-out mice, we provide data supporting an essential role of MN1 in maintaining appropriate osteoblast proliferation, differentiation, and function. MN1 knock-out osteoblasts displayed altered morphology, decreased growth rate, impaired motility, and attenuated 1,25(OH)(2)D(3)/VDR-mediated transcription as well as reduced alkaline phosphatase activity and mineralized nodule formation. MN1 null osteoblasts were also impaired in supporting osteoclastogenesis in co-culture studies presumably because of marked reduction in the RANKL:OPG ratio in the MN1 null cells. Mechanistic studies supported a transcriptional role for MN1 in controlling RANKL gene expression through activation of the RANKL promoter. Cumulatively, these studies indicate an important role for MN1 in maintaining the appropriate maturation and function of calvarial osteoblasts.


Figures

FIGURE 1.
FIGURE 1.
MN1 mRNA transcripts are induced by 1,25(OH)2D3 and by osteoblastic cell differentiation. MC3T3-E1 cells (A) or primary calvarial osteoblasts (B) were maintained at the proliferating stage or differentiated for 2 weeks as described under “Experimental Procedures.” Proliferating or differentiating cells were treated with 10 nm 1,25(OH)2D3 for the indicated times, and the expression of MN1, 24-hydroxylase, VDR, or 18 S RNA was examined by Northern blot analysis. C, primary osteoblasts were differentiated for the indicated times, and the expression of MN1 or 18 S RNA was examined by Northern blot analysis. D, total RNA was extracted from indicated tissues of 6-week-old wild-type mice, and the expression of MN1 was determined by Northern blot analysis. Ethidium bromide staining of 18 S/28 S ribosomal RNA was used to normalize loading differences.
FIGURE 2.
FIGURE 2.
MN1 knock-out osteoblasts have diminished VDR-mediated transcriptional responses. Subconfluent WT and MN1 KO primary osteoblasts were transiently transfected with a 1.2-kb human 24-hydroxylase promoter reporter (cyp24(-1200)-luc in A) or a multicopy VDRE-driven reporter (VDRE4-TATA-luc in B). Cells were treated with the indicated concentration of 1,25(OH)2D3 for 24 h, and the normalized luciferase activity was measured as described under “Experimental Procedures.” Data represent the mean ± S.D. (n = 4 in each group). C, RNA was isolated from MN1 WT or KO cells that were treated ethanol vehicle (−) or 10 nm 1,25(OH)2D3 (+) for 24 h. The expression of 24-hydroxylase and glyceraldehyde-3-phosphate dehydrogenase (GAPDH) was examined by Northern blot analysis.
FIGURE 3.
FIGURE 3.
MN1 knock-out osteoblasts have reduced growth rate. A, WT and MN1 KO primary osteoblasts were plated at a density of 1 × 10³ cells/cm2 and treated with ethanol vehicle (-D) or 10 nm 1,25(OH)2D3 (+D) at day 0. Trypan blue-excluding cells were counted at the indicated time points. Data represent the mean ± S.D. (n = 3 in each group). B, MN1 WT and KO primary osteoblasts were plated at equal densities and treated with ethanol vehicle (-D) or 10 nm 1,25(OH)2D3 (+D) for 72 h. Cells were labeled with BrdUrd, and the BrdUrd-positive cells were quantitated. Data represent the mean ± S.D. (n = 3 in each group). C, the percentage of growth inhibition by 4-day treatment of 10 nm 1,25(OH)2D3 from three independent MTT assays. Data represent the mean ± S.D. (n = 3 in each group).
FIGURE 4.
FIGURE 4.
MN1 knock-out calvarial cells have reduced proliferation in vivo. The BrdUrd-labeled calvaria from WT or MN1 KO E18.5 embryos were prepared as described under “Experimental Procedures.” Three distinct sections from different areas of each calvarium were analyzed for BrdUrd (BrdU) incorporation and counterstained with 4′,6-diamidino-2-phenylindole (DAPI). A, representative images of BrdUrd and 4′,6-diamidino-2-phenylindole stained sections. B, the percentage of BrdUrd-positive cells was quantitated. Five embryos from each genotype were analyzed. Data represent the mean ± S.D. (n = 15 individual sections in each group).
FIGURE 5.
FIGURE 5.
MN1 knock-out osteoblasts have altered morphology and decreased motility. A, representative phase contrast images of sub-confluent WT and MN1 KO primary osteoblasts. B, MN1 wild-type or knock-out cells were grown to confluence, and linear scratches were created. Pictures were taken 0 and 16 h after injury. The black dashed lines mark the wound edges. C, the percentage of wound closure was quantified and presented as the mean ± S.D. (n = 9 in each group).
FIGURE 6.
FIGURE 6.
MN1 knock-out osteoblasts show decreased differentiation and mineralization. A, WT and MN1 KO osteoblasts were cultured for 28 days in differentiation media and stained in situ for alkaline phosphatase (ALP) enzyme activity. Representative images of alkaline phosphatase stained cultures are shown. Color images are shown in supplemental Fig. 1. B, MN1 WT or KO osteoblasts were cultured under osteogenic conditions for the indicated times. Alkaline phosphatase activity was determined with a colorimetric assay as described under “Experimental Procedures.” C, Northern analysis of alkaline phosphatase transcript levels in differentiating cultures of WT and MN1 KO calvarial osteoblasts. D and E, WT and MN1 KO osteoblasts were cultured for 31 days in differentiation media and stained for mineralized nodules with Alizarin Red S. D, representative images of Alizarin Red S stained cultures. Darkened areas are mineralized nodules. Color images are shown in supplemental Fig. 1. E, mineralized nodules were quantitated and compared (unfilled bars). The Alizarin Red S stain was extracted with 100 mm cetylpyridinium chloride, and the absorbance at 500 nm (absorbance500 nm) was measured (filled bars). Data represent the mean ± S.D. (n = 3 in each group).
FIGURE 7.
FIGURE 7.
MN1 knock-out calvarial cells have reduced expression of osteoblastic genes in vitro and in vivo. A, WT and MN1 KO osteoblasts were cultured under osteogenic conditions for the indicated times. The expression of BSP2, DMP1, Runx2, osterix, and 18 S RNA were determined by TaqMan real-time reverse transcription-PCR approaches using 18 S RNA as an internal control. B, total RNA was extracted from WT and MN1 KO E18.5 calvaria. The expression of MN1, Runx2, osterix, BSP2, alkaline phosphatase (ALP), osteocalcin (OC), and cyclophilin B (CypB) was examined by Northern blot analysis. Cyclophilin B expression was used as a loading control.
FIGURE 8.
FIGURE 8.
MN1 knock-out osteoblasts have reduced ability to support 1,25(OH)2D3-stimulated osteoclastogenesis. A, osteoclastogenic co-culture analysis was performed as described under “Experimental Procedures” using WT and MN1 KO osteoblasts. Co-cultures were stained for TRAP, an osteoclast-selective marker. Representative images of TRAP-stained co-cultures are shown. Color images are shown in supplemental Fig. 1. B, TRAP-positive multinucleated cells (≥3 nuclei) were counted and compared. Data represent the mean ± S.D. (n = 3 in each group). The inset shows a high magnification image of TRAP positive, multinucleated osteoclasts. The scale bar represents 60 μm. C, MN1 WT and KO osteoblasts were differentiated for 15 days and treated with ethanol (−) or 10 nm 1,25(OH)2D3 (+) for 24 h. Northern blot analysis was performed to examine mRNA expression levels of OPG, RANKL, macrophage colony-stimulating factor (M-CSF), or 18 S RNA.
FIGURE 9.
FIGURE 9.
MN1 stimulates RANKL promoter activity. A, MC3T3-E1 cells were transiently transfected with a 1-kb human RANKL promoter reporter gene (hRANKL(−1kb)-luc) or pGL3 control reporter gene. The indicated amounts of the MN1 expression plasmid were cotransfected with the total molar amount of expression plasmid DNA kept constant by the addition of empty vector. The normalized luciferase activity was measured after 48 h. Data represent the mean ± S.D. (n = 3 in each group). B, control siRNA (−) or MN1 siRNA (+) was transfected into MC3T3-E1 cells 24 h before pGL3 or hRANKL(−1kb)-luc was transfected. The normalized luciferase activity was measured 48 h later. Data represent the mean ± S.D. (n = 3 in each group). The inset shows a Northern blot analysis of MN1 mRNA expression 24 h after siRNA transfection. C, WT or MN1 KO primary osteoblasts were transfected with pGL3 or hRANKL(−1kb)-luc. The normalized luciferase activity was measured after 48 h. Data represent the mean ± S.D. (n = 3 in each group). D, WT or KO primary osteoblasts were transiently transfected with pGL3 or hRANKL(−1kb)-luc. The indicated amounts of the MN1 expression plasmid were cotransfected with the total molar amount of expression plasmid DNA kept constant by the addition of empty vector. The normalized luciferase activity was measured after 48 h. Data represent the mean ± S.D. (n = 3 in each group).

Similar articles

Cited by

References

    1. Bianco P., Riminucci M., Gronthos S., Robey P. G. ( 2001) Stem Cells 19, 180– 192 - PubMed
    1. Kassem M., Abdallah B. M., Saeed H. ( 2008) Arch. Biochem. Biophys. 473, 183– 187 - PubMed
    1. Aubin J. E. ( 1998) J. Cell. Biochem. Suppl. 30–31, 73– 82 - PubMed
    1. Miyamoto T., Suda T. ( 2003) Keio J. Med. 52, 1– 7 - PubMed
    1. Teitelbaum S. L., Ross F. P. ( 2003) Nat. Rev. Genet. 4, 638– 649 - PubMed

Publication types

MeSH terms