

Differential regulation of actin polymerization and structure by yeast formin isoforms
- PMID: 19386598
- PMCID: PMC2719313
- DOI: 10.1074/jbc.M109.006981
Differential regulation of actin polymerization and structure by yeast formin isoforms
Abstract
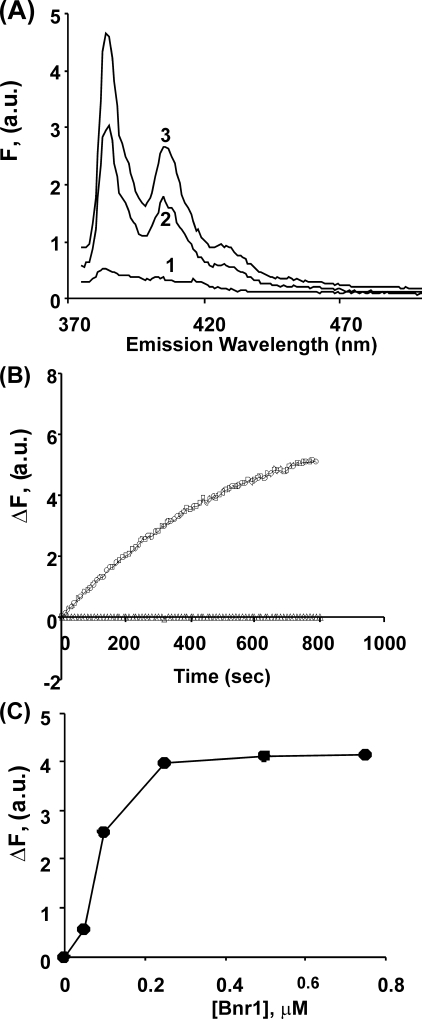
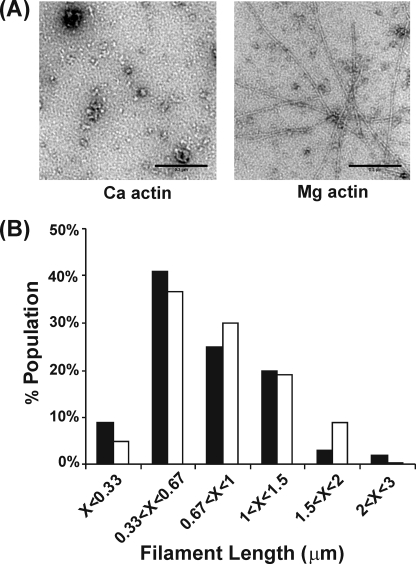
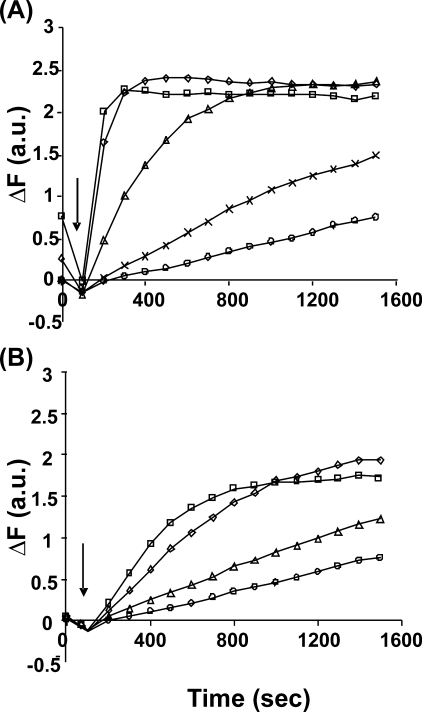
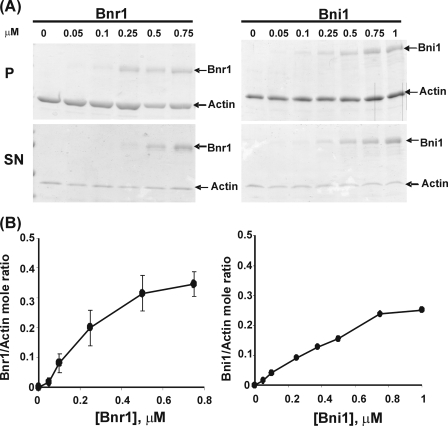
The budding yeast formins, Bnr1 and Bni1, behave very differently with respect to their interactions with muscle actin. However, the mechanisms underlying these differences are unclear, and these formins do not interact with muscle actin in vivo. We use yeast wild type and mutant actins to further assess these differences between Bnr1 and Bni1. Low ionic strength G-buffer does not promote actin polymerization. However, Bnr1, but not Bni1, causes the polymerization of pyrene-labeled Mg-G-actin in G-buffer into single filaments based on fluorometric and EM observations. Polymerization by Bnr1 does not occur with Ca-G-actin. By cosedimentation, maximum filament formation occurs at a Bnr1:actin ratio of 1:2. The interaction of Bnr1 with pyrene-labeled S265C Mg-actin yields a pyrene excimer peak, from the cross-strand interaction of pyrene probes, which only occurs in the context of F-actin. In F-buffer, Bnr1 promotes much faster yeast actin polymerization than Bni1. It also bundles the F-actin in contrast to the low ionic strength situation where only single filaments form. Thus, the differences previously observed with muscle actin are not actin isoform-specific. The binding of both formins to F-actin saturate at an equimolar ratio, but only about 30% of each formin cosediments with F-actin. Finally, addition of Bnr1 but not Bni1 to pyrene-labeled wild type and S265C Mg-F actins enhanced the pyrene- and pyrene-excimer fluorescence, respectively, suggesting Bnr1 also alters F-actin structure. These differences may facilitate the ability of Bnr1 to form the actin cables needed for polarized delivery of nutrients and organelles to the growing yeast bud.
Figures


Similar articles
-
Yeast formins Bni1 and Bnr1 utilize different modes of cortical interaction during the assembly of actin cables.Mol Biol Cell. 2007 May;18(5):1826-38. doi: 10.1091/mbc.e06-09-0820. Epub 2007 Mar 7. Mol Biol Cell. 2007. PMID: 17344480 Free PMC article.
-
Differential activities and regulation of Saccharomyces cerevisiae formin proteins Bni1 and Bnr1 by Bud6.J Biol Chem. 2005 Jul 29;280(30):28023-33. doi: 10.1074/jbc.M503094200. Epub 2005 May 27. J Biol Chem. 2005. PMID: 15923184
-
Tropomyosin and Profilin Cooperate to Promote Formin-Mediated Actin Nucleation and Drive Yeast Actin Cable Assembly.Curr Biol. 2016 Dec 5;26(23):3230-3237. doi: 10.1016/j.cub.2016.09.053. Epub 2016 Nov 17. Curr Biol. 2016. PMID: 27866892 Free PMC article.
-
Mechanostress resistance involving formin homology proteins: G- and F-actin homeostasis-driven filament nucleation and helical polymerization-mediated actin polymer stabilization.Biochem Biophys Res Commun. 2018 Nov 25;506(2):323-329. doi: 10.1016/j.bbrc.2018.09.189. Epub 2018 Oct 9. Biochem Biophys Res Commun. 2018. PMID: 30309655 Review.
-
Formins: signaling effectors for assembly and polarization of actin filaments.J Cell Sci. 2003 Jul 1;116(Pt 13):2603-11. doi: 10.1242/jcs.00611. J Cell Sci. 2003. PMID: 12775772 Review.
Cited by
-
Formin follows function: a muscle-specific isoform of FHOD3 is regulated by CK2 phosphorylation and promotes myofibril maintenance.J Cell Biol. 2010 Dec 13;191(6):1159-72. doi: 10.1083/jcb.201005060. J Cell Biol. 2010. PMID: 21149568 Free PMC article.
-
Nucleation limits the lengths of actin filaments assembled by formin.Biophys J. 2021 Oct 19;120(20):4442-4456. doi: 10.1016/j.bpj.2021.09.003. Epub 2021 Sep 8. Biophys J. 2021. PMID: 34506773 Free PMC article.
-
Conformational dynamics of actin: effectors and implications for biological function.Cytoskeleton (Hoboken). 2010 Oct;67(10):609-29. doi: 10.1002/cm.20473. Cytoskeleton (Hoboken). 2010. PMID: 20672362 Free PMC article. Review.
-
Characterization of the biochemical properties and biological function of the formin homology domains of Drosophila DAAM.J Biol Chem. 2010 Apr 23;285(17):13154-69. doi: 10.1074/jbc.M109.093914. Epub 2010 Feb 21. J Biol Chem. 2010. PMID: 20177055 Free PMC article.
-
Vinculin nucleates actin polymerization and modifies actin filament structure.J Biol Chem. 2009 Oct 30;284(44):30463-73. doi: 10.1074/jbc.M109.021295. Epub 2009 Sep 7. J Biol Chem. 2009. PMID: 19736312 Free PMC article.
References
-
- Evangelista M., Pruyne D., Amberg D. C., Boone C., Bretscher A. ( 2002) Nat. Cell Biol. 4, 260– 269 - PubMed
-
- Sagot I., Rodal A. A., Moseley J., Goode B. L., Pellman D. ( 2002) Nat. Cell Biol. 4, 626– 631 - PubMed
-
- Kovar D. R. ( 2006) Curr. Opin. Cell Biol. 18, 11– 17 - PubMed
-
- Goode B. L., Eck M. J. ( 2007) Annu. Rev. Biochem. 76, 593– 627 - PubMed
-
- Wallar B. J., Alberts A. S. ( 2003) Trends Cell Biol. 13, 435– 446 - PubMed
Publication types
MeSH terms
Substances
Grants and funding
LinkOut - more resources
Full Text Sources
Molecular Biology Databases
Miscellaneous
