. 2009 Jul;19 Suppl 1(Suppl 1):i32-41.
doi: 10.1093/cercor/bhp040. Epub 2009 Apr 22.

Neurovascular congruence during cerebral cortical development

Affiliations

Neurovascular congruence during cerebral cortical development

Daniel Stubbs et al. Cereb Cortex. 2009 Jul.

Abstract

There is evidence for interaction between the developing circulatory and nervous systems. Blood vessels provide a supporting niche in regions of adult neurogenesis. Here we present a systematic analysis of vascular development in the embryonic murine cortex and demonstrate that dividing cells, including Tbr2-positive intermediate progenitor cells, are closer to the vasculature than expected from a random distribution. To examine whether neurites of the newly generated embryonic neurons find blood vessels as an attractive and permissive substrate, we overlayed green fluorescent protein (GFP)-labeled dissociated cortical progenitors on embryonic organotypic cortical slice cultures with labeled vasculature. Our observations of neurites extending toward and along labeled blood vessels support the notion of vascular-neuronal interactions. The altered cortical layering had no obvious effect on the vascular patterns within the cortical plate (CP) in shaking rat Kawasaki (SRK) and the reeler mutant mouse at the ages studied (E19 and P3). It appears that similarly to other neurogenic regions in the adult, the embryonic "vascular niche" might influence neural progenitor cells during telencephalic neurogenesis, neuronal migration, and neurite extension, but the laminar phenotype of cell classes within the CP has limited influence on the developing vasculature.


Figures

Figure 1.
Figure 1.
Panel 1: Gross pattern of vascular development revealed by OPT (AC) and on histological section (D). (A, B) Reconstructions of the E18 brain perfused with IB4 and scanned with OPT. The same brain is shown from the dorsal (A) and ventral (B) surface. The developing vasculature is revealed to an impressive degree of clarity. (C) An example for a parasagittal 2D slice generated from the same E18 data set shown in panels (A, B using Volocity. (D) Coronal section (40 μm thick) of an E14.5 brain perfused with IB4. VZ, ventricular zone; SVZ, subventricular zone; IZ, intermediate zone; SP, subplate; CP, cortical plate; and MZ, marginal zone. Scale bar for (AC): 1 mm; 50 μm for (D). Panel 2: Developmental stages of blood vessel formation in putative somatosensory cortex in the mouse. Panels (AF; left column) show fluorescent images of blood vessels labeled with IB4 on coronal sections (40 μm thick) at E12.5, 14, 15, 18 (2 examples from 2 different brains, A, A′–D, D′); one for P8 (E) and adult (F). (GK) Show generalized schematic drawings of the layout of cortical blood vessel plexi at each stage. At E14 and 15, there are 2 dense plexi in the germinal zone (VZ and SVZ) and CP, connected by tangential blood vessels (arrows in B, C). The region of SP and white matter might correspond to region of poorer perfusion. MZ, marginal zone; I–VI represent cortical layers in adult. Scale: 100 μm. Panel 3: Association of SVZ blood vessels to mitotic profiles in CTX and GE in an E14 brain. (A) Demonstrates the overall pattern of blood vessels (revealed with IB4-green) and the mitotic profiles (revealed with H3-red immunoreactivity) on a low power image of the cortex. (A) Demonstrates the cortical plexi and the mitotic profiles in the SVZ and VZ. The section was counterstained with DAPI, appears blue. Panels (B, C) show examples for confocal microscopic reconstructions of mitotic cells in contact with blood vessels in the cortical SVZ (B) and in the GE (C). Scale bar for (A): 100 μm.
Figure 2.
Figure 2.
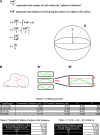
Model and formula derivation for calculating the expected distance between a cell and blood vessel (A) and actual measurement performed (BB″) together with the data obtained with the different methods (Tables 1–3). (A) Derivation of the model. The model states that the average distance of a cell (r-) equals the total number of cells divided by their cumulative total distance. (BB″) Schematic diagram explaining the process of quantification. (B) Whole brains were perfused, embedded, and cut into 40 μm coronal sections. (B′) The outer limits of individual 40 μm sections may contain areas that have been cut away from vessels that were nearby in the whole brain but were not included in the actual section. (B″) Only the tissue at least R μm from surfaces of the section (the innermost parts) was analyzed to exclude areas of sections that may have been influenced by undocumented blood vessels, only apparent in previous or subsequent sections. For example, R = 17.06 μm for E12.5 cortex and 19.69 μm for E14 cortex. r- Values were calculated from these values (Figs 4 and 5). Tables 1–3: Table 1—The distances between the blood vessels and H3 immunoreactive mitotic profiles were measured in E12.5 and E14 CTX and GE. The data obtained for this analysis were pooled from 3 brains for each age studied. Theoretical distance and the actual distance have been compared. Table 2 similar as Table 2 but for Tbr2-eGFP mitotic profiles. Table 3 similar to Tables 1 and 2 but for Tbr2 immunoreactive mitotic profiles. Significance between model and obtained data was determined using a 1-sample t-test. All were significant (P < 0.001). No standard deviation can be calculated for the model distance. These results show that H3 immunoreactive, Tbr2-eGFP mitotic profiles, or Tbr2 immunoreactive mitotic profiles are closer to the vasculature than a quiescent cell is expected to be.
Figure 3.
Figure 3.
GFP expressing cells in the Tbr2-eGFP mouse (AE′) or Tbr2 immunoreactive cells in SVZ (FF′) undergo mitosis near blood vessels in the neocortical germinal zones. (A) Endogenous GFP expression in an E14.5 Tbr2-eGFP mouse neocortex shows a GFP+ cell undergoing mitosis (arrow) adjacent to a profile of a blood vessel (arrowheads). (B) IB4-Alexa594 (red) staining reveals a blood vessel (arrowheads) adjacent to Tbr2-eGFP+ mitotic figure (arrow). (C) The 3D reconstruction of a Z-series reveals a Tbr2-eGFP-positive cell undergoing mitosis (arrow) in the SVZ on E14.5 in close proximity to a large blood vessel (red). Cross section delineated by white lines. Blue counterstain TO-PRO (A) and DAPI (B, C). Scale bar: 50 μm. (DE) Low-power confocal microscopic images taken from horizontal sections through the SVZ of E14.5 Tbr2-eGFP brain. The figure demonstrates that the orientation of blood vessels changes from radial to tangential as they ascend from VZ to SVZ. The panels in (DE) demonstrate that the eGFP-positive cells have a close association to blood vessels in the radially oriented VZ (D) and continue in the tangentially oriented SVZ (E). (E′) Is a high-power image from (E) to provide example of the close association. Scale: 100 μm for (D, E) and 25 μm for (E′). (F) E14.5 sections were processed Tbr2 immunohistochemistry to further validate the results that eGFP expressing dividing cells (presumed intermediate progenitors) in the Tbr2-eGFP mouse are closer to the vasculature than a quiescent cell is expected to be. Tbr2 immunoreactivity has been the most intensive along a band through cortical SVZ (appear green). (F′) Confocal microscopic reconstruction of the region in SVZ labeled with a box in (F) to demonstrate the Tbr2 and H3 immunoreactivity and the IB4-positive blood vessel. Scale: 100 μm in (F) and 10 μm in (F′).
Figure 4.
Figure 4.
Panel 1: The close relationship between the IB4-labeled blood vessels (green) and doublecortin (DCX) immunoreactive cortical neurons and their neurites (red) suggests early cortical vascular scaffold. (A) Single optical slice through confocal stack (B), close association between DCX immunoreactive processes and IB4 immunoreactive blood vessels. (C) Enlargement from the area indicated with a box in (B) showing association between blood vessels and some DCX neurons/neurites in the germinal zone. Panel 2: Association of GFP labeled cortical germinal zone neurites and close apposition of labeled cells with labeled cortical vasculature in vitro suggests interaction with vascular scaffold. (A, B) Results from an experiment showing eGFP-positive newly born cells (labeled with VZ electroporation shortly before dissociation) and their processes extending toward and in contact with vasculature (prelabeled with IB4 perfusion before culturing) and examined after t= 26 h (A) and t= 42 h (B), respectively. Note that after 26 h, the cell in (A) extends its process toward the blood vessel (insert in A) and approaches the blood vessel by 42 h (B). (B) Has been taken from the same region as (A). (C, D) Results from an additional series of overlay culture experiment showing GFP-positive signal in contact with vascular plexus (C, 9 h and D, 25 h). The red and green profiles align in close register in the 25-h culture. The greater number of cells in later picture is presumably due to increased GFP expression; the less clear vascular pattern is due to removal of some of the endothelial cells after longer culturing period. Scale: 100 μm. Panel 3: Normal CP vasculature in the SRK and reeler mouse. (A, B) Inversion of cortical lamination does not alter the general pattern of the cortical vascular plexi in E19 SRK cortex. Blood vessels have been stained with IB4 (appear green) on coronal sections through WT (A) rat and SRK (B) putative somatosensory cortices. There is little difference between mutant and wild type with similar penetrating vessels through CP and dense plexi in the germinal zones. At the end of neurogenesis, the plexi around the VZ is still the densest in both. The CP is penetrated with blood vessels according to very similar pattern in the WT and SRK, but the intermediate zone contains less tangential blood vessels in the SRK cortex. Nevertheless, the plexi present in CP and germinal zone are still interconnected in both. Panels (C, D) show indistinguishable cortical vascular pattern in a P8 WT (C) and reeler mutant mouse (D) somatosensory cortex. Scale in (A) 100 μm and applies for (B); in (C) 100 μm and applies for (D).

References

    1. Aikawa H, Nonaka I, Woo M, Tsugane T, Esaki K. Shaking Rat Kawasaki (SRK) a new mutant in the wistar strain. Acta Neuropathol. 1988;76(4):366–372. - PubMed
    1. Beck L, Jr, D'amore PA. Vascular development: cellular and molecular regulation. FASEB J. 1997;11(5):365–373. - PubMed
    1. Bovetti S, Hsieh Y-C, Bovolin P, Perroteau I, Kazunori T, Puche AC. Blood vessels form a scaffold for neuroblast migration in the adult olfactory bulb. J Neurosci. 2007;27:5976–5980. - PMC - PubMed
    1. Carmeliet P, Tessier-Levigne M. Common mechanisms of nerve and blood vessel wiring. Nature. 2005;436(7048):193–200. - PubMed
    1. Carney RS, Bystron I, López-Bendito G, Molnár Z. Comparative analysis of extra-ventricular mitoses at early stages of cortical development in rat and human. Brain Struct Funct. 2007;212(1):37–54. - PubMed

Publication types

MeSH terms