. 2009 Jul;102(1):85-99.
doi: 10.1152/jn.91113.2008. Epub 2009 Apr 22.

Task-dependent modulation of primary afferent depolarization in cervical spinal cord of monkeys performing an instructed delay task

Affiliations

Task-dependent modulation of primary afferent depolarization in cervical spinal cord of monkeys performing an instructed delay task

Kazuhiko Seki et al. J Neurophysiol. 2009 Jul.

Abstract

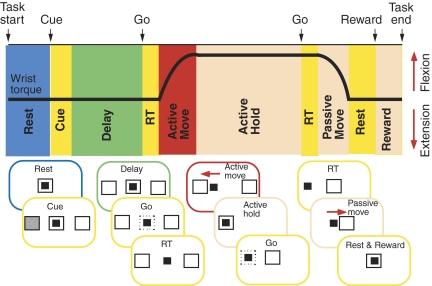
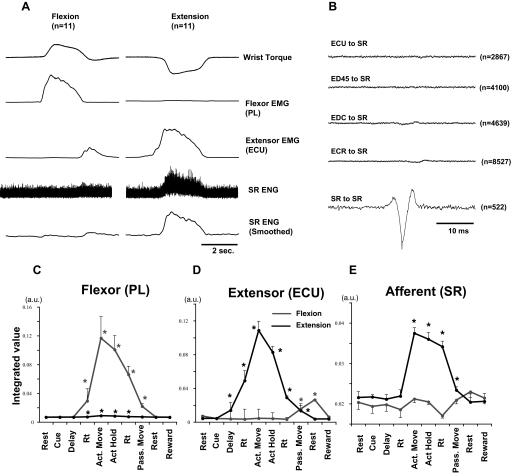
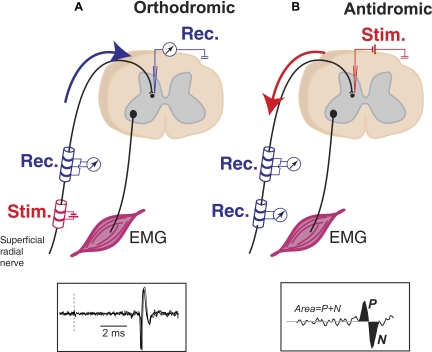
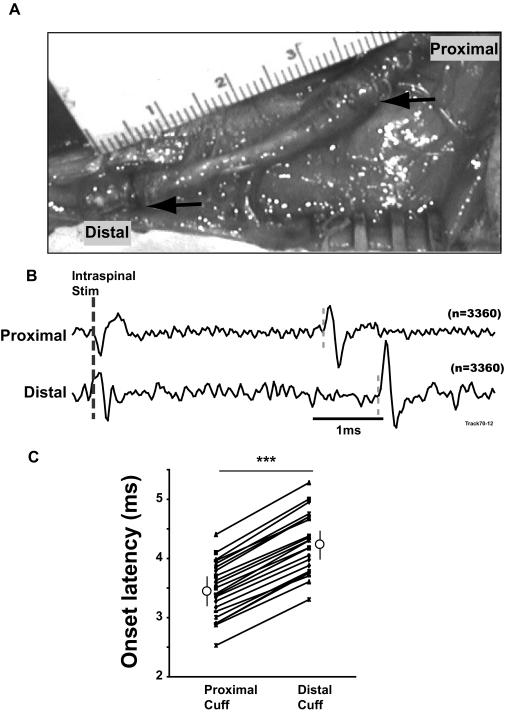
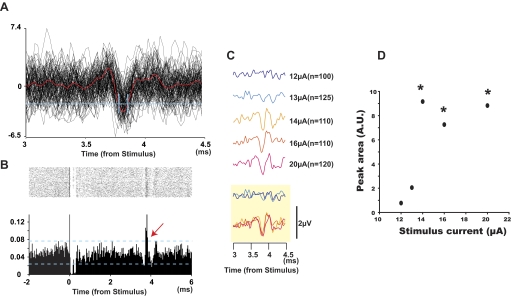
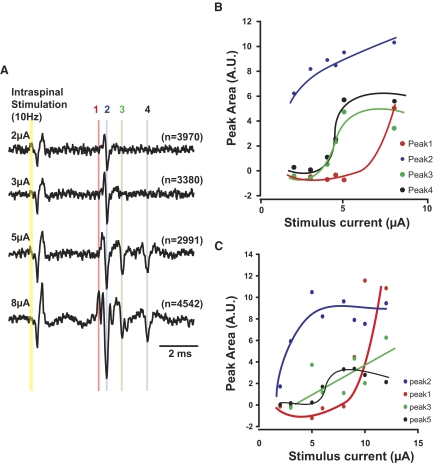
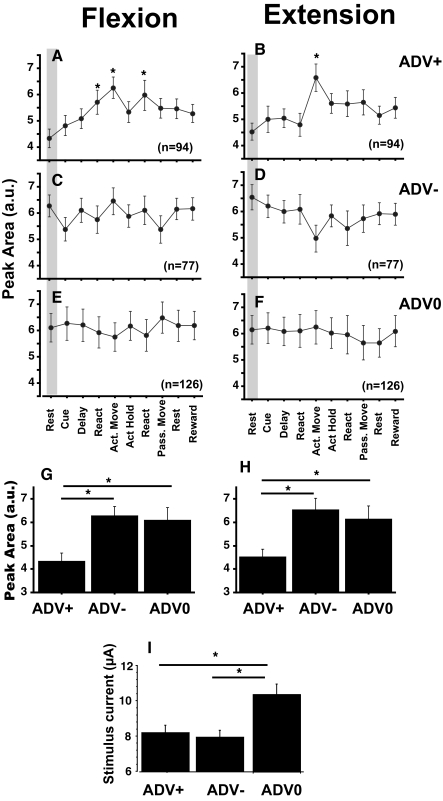
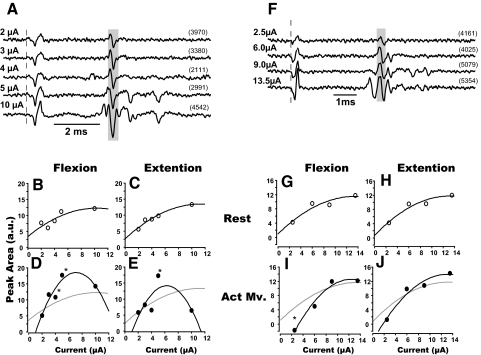
Task-dependent modulation of primary afferent depolarization (PAD) was studied in the cervical spinal cord of two monkeys performing a wrist flexion and extension task with an instructed delay period. We implanted two nerve cuff electrodes on proximal and distal parts of the superficial radial nerve (SR) and a recording chamber over a hemi-laminectomy in the lower cervical vertebrae. Antidromic volleys (ADVs) in the SR were evoked by intraspinal microstimuli (ISMS, 3-10 Hz, 3-30 microA) applied through a tungsten microelectrode, and the area of each ADV was measured. In total, 434 ADVs were evoked by ISMS in two monkeys, with onset latency consistently shorter in the proximal than distal cuffs. Estimated conduction velocity suggest that most ADVs were caused by action potentials in cutaneous fibers originating from low-threshold tactile receptors. Modulation of the size of ADVs as a function of the task was examined in 281 ADVs induced by ISMS applied at 78 different intraspinal sites. The ADVs were significantly facilitated during active movement in both flexion and extension (P<0.05), suggesting an epoch-dependent modulation of PAD. This facilitation started 400-900 ms before the onset of EMG activity. Such pre-EMG modulation is hard to explain by movement-induced reafference and probably is associated with descending motor commands.


Figures

FIG. 1.
FIG. 1.
Wrist flexion-extension task. Typical torque trace during a single flexion trial is shown with task epochs. Diagrams below depict the cursor controlled by the monkey (small filled square) and targets (larger squares) on video screen for the 10 epochs: 1st rest, cue, delay, 1st reaction time (RT), active move, active hold, 2nd RT, passive move, 2nd rest, reward.
FIG. 2.
FIG. 2.
Activities of superficial radial nerve (SR) and muscles during wrist flexion and extension. A: typical records of average wrist torque, activity in superficial radial nerve (SR) and muscles (flexor, extensor) during flexion (left) and extension (right) trials (11 trials). Low-pass filter (3 Hz) was used to smooth EMG and electroneurogram (ENG) profiles. Flexor [palmaris longus (PL)] and extensor [extensor carpi ulnaris (ECU)] muscles generally showed reciprocal pattern of activity during task, and SR was active during extensor torque. B: test for possible cross-talk between EMG and ENGs. Averages of unrectified ENG were triggered from wrist extensor muscle or nerve activity when EMG exceeded a threshold level, just above the baseline noise of unrectified EMG. Note that there were no significant peaks in any EMG-to-SR average (i.e., <10% of the SR-to-SR peak). C--E: mean ± SE EMG (arbitrary units) of PL, ECU, and ENG of SR during each behavioral epoch (14 flexion, 13 extension trials were summed). *Significantly different from activity during pretrial rest, P < 0.05.
FIG. 3.
FIG. 3.
Orthodromic and antidromic responses from SR. A: before the excitability testing, intraspinal terminals of SR were localized by finding interneurons that responded monosynaptically to electrical stimulation of SR. Single-unit or field potentials were recorded using a microelectrode inserted into the spinal gray matter. Bottom inset: successive monosynaptic responses of interneuron to stimulation at dashed line. B: microstimuli were applied to the electrodes at the recording sites to activate the terminal of SR afferents. Antidromic volleys (ADVs) evoked by the stimulation were recorded by the cuff electrodes. Inset: size of the ADVs was measured by area of positive and negative peaks.
FIG. 4.
FIG. 4.
Antidromically conducted responses in SR induced by intraspinal microstimulation (ISMS). A: Tri-polar (proximal) and bipolar (distal) cuff electrodes implanted on SR. B: Responses in the proximal and distal cuffs evoked by intraspinal stimulation (4 μA). C: comparison of the onset latencies of the responses recorded in the 2 cuff electrodes (n = 22). Open circles and vertical lines show mean ± SD of the data. ***P < 0.001.
FIG. 5.
FIG. 5.
Antidromic responses in single afferent. A: superposition of 100 raw traces recorded from SR aligned with ISMS; mean waveform is shown in red. A dual time-amplitude window discriminator was used to discriminate individual antidromic responses (threshold level and 2 time windows shown in blue). B: dot raster and peristimulus time histogram (PSTH) of all discriminated events in A show time-locked responses around 3.8 ms (red arrow). C: responses evoked by different stimulus currents: 12–13 μA evoked no volley; 14–20 μA evoked volleys with a fixed amplitude. Overlapping plots of traces shown at bottom (yellow box). D: peak area of the ADVs as a function of stimulus current. A.U. means arbitrary units. This “all-or-none” recruitment pattern suggests that responses were from a single SR afferent. *Significantly different from the background noise measured 2–3 ms after each stimulus, P < 0.05.
FIG. 6.
FIG. 6.
Recruitment curves of ADVs. A: increasing stimulus currents usually recruited multiple volleys with different latencies. B and C: sizes of ADVs as a function of the stimulus currents for 2 sites. B refers to sweeps in A. Note that the amplitudes of volleys 3 and 4 in B and 2 and 5 in C saturated at the higher currents tested.
FIG. 7.
FIG. 7.
Conduction velocity of recorded antidromic responses. Distribution of conduction velocity of ADVs in monkey M (A) and monkey K (B). Second axis also shows onset latency from ISMS. A: mean ± SD (open circles and lines) was 55.2 ± 13.9 m/s (4.95 ± 4.99 ms from stimulus). B: mean ± SD was 66.5 ± 9.9 m/s (5.58 ± 1.27 ms).
FIG. 8.
FIG. 8.
Excitability testing during wrist flexion-extension task. A: ADVs in SR induced by ISMS of a single intraspinal site in each behavioral epoch during flexion trials; stimulus time is at the left of the traces. Two distinct volleys (gray lines) were apparent in all behavioral epochs. B and C: mean ± SE of the amplitude of ADVs with earlier (B) and later (C) latencies in each behavioral epoch. *Significant difference relative to rest (P < 0.05). Number of responses averaged for each trace is shown in parentheses.
FIG. 9.
FIG. 9.
Modulation of the size of average ADVs. A–F: mean ± SE area of ADVs evoked from all spinal sites during the 10 behavioral epochs in flexion (left) and extension (right) trials. Volleys were separated into groups that exhibited facilitation (ADV+), suppression (ADV−), or no modulation (ADV0) in at least 1 behavioral epoch relative to the rest period. Numbers of ADVs in each group are shown in each panel. *Significantly different from volley during rest (shaded), P < 0.05. G and H: comparison of the area of ADVs during rest. I: stimulus current used to evoke volleys in each category.
FIG. 10.
FIG. 10.
Recruitment properties of ADVs during active movements. A and F: ADVs induced by ISMS (broken line) at 2 different intraspinal sites with various current strengths (all epochs combined). B–E and G–J: changes of the amplitude of ADVs as a function of the stimulus current during rest (B, C, G, and H) and active movement (D, E, I, and J) for flexion (B, D, G, and I) and extension (C, E, H, and J). *Significantly larger volley during active movement vs. rest period for the same stimulus current, P < 0.05. Note that ADV facilitation was observed only when current of 4–5 μA was used. Gray lines in D, E, I, and J are fits for data at rest for comparison.
FIG. 11.
FIG. 11.
Conduction velocities. Histograms of conduction velocities (CVs) of ADVs with task-dependent facilitation (A, ADV+), suppression (B, ADV−), and no modulation (C, ADV0). The mean ± SE CVs of these groups were statistically different (D, P < 0.05). ADVs with CVs of <20 m/s (open bars in A–C) were not included in the statistical test.
FIG. 12.
FIG. 12.
Premovement onset of PAD modulation. Mean area of antidromic potentials that showed facilitation (top) or suppression (bottom) during active movement and/or reaction time were plotted relative to EMG onset (left: PL; right: ED45). Open circle at left of each panel shows ADV area during rest period. *Mean amplitude significantly different from rest, P < 0.05. Vertical axis, area of ADV (au); horizontal axis, time from onset of EMG (ms).

References

    1. Aimonetti JM, Vedel JP, Schmied A, Pagni S. Mechanical cutaneous stimulation alters Ia presynaptic inhibition in human wrist extensor muscles: a single motor unit study. J Physiol 522: 137–145, 2000. - PMC - PubMed
    1. Alvarez-Leefmans FJ, Gamino SM, Giraldez F, Nogueron I. Intracellular chloride regulation in amphibian dorsal root ganglion neurones studied with ion-selective microelectrodes. J Physiol 406: 225–246, 1988. - PMC - PubMed
    1. Andersen P, Eccles JC, Sears TA. Cortically evoked depolarization of primary afferent fibers in the spinal cord. J Neurophysiol 27: 63–77, 1964. - PubMed
    1. Baev KV, Panchin Iu V, Skryma RN. Depolarization of primary afferents during fictitious scratching of thalamic cats. Neirofiziologiia 10: 173–176, 1978. - PubMed
    1. Baldissera F, Broggi G, Mancia M. Primary afferent depolarization of trigeminal fibres induced by stimulation of brain stem and peripheral nerves. Experientia 23: 398–400, 1967. - PubMed

Publication types