. 2009 Jun;20(12):2885-99.
doi: 10.1091/mbc.e08-12-1160. Epub 2009 Apr 22.

Specificity of cytoplasmic dynein subunits in discrete membrane-trafficking steps

Affiliations

Specificity of cytoplasmic dynein subunits in discrete membrane-trafficking steps

Krysten J Palmer et al. Mol Biol Cell. 2009 Jun.

Abstract

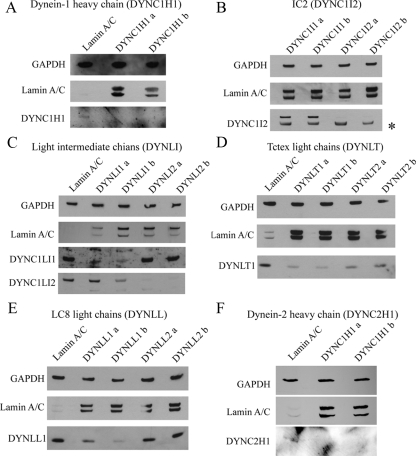
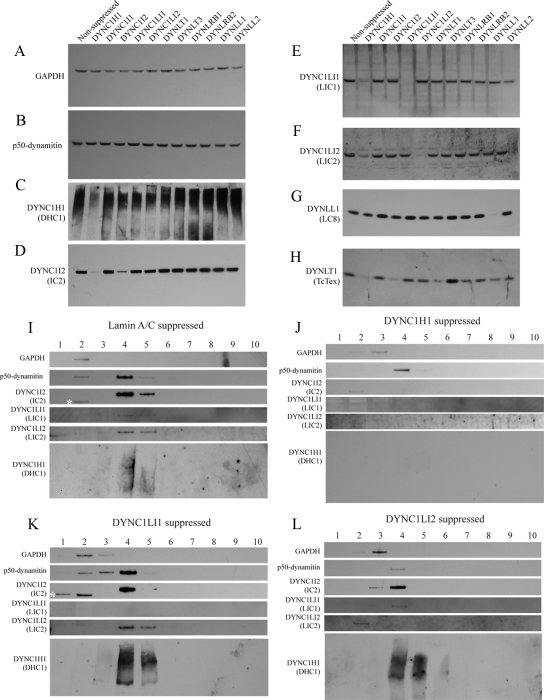
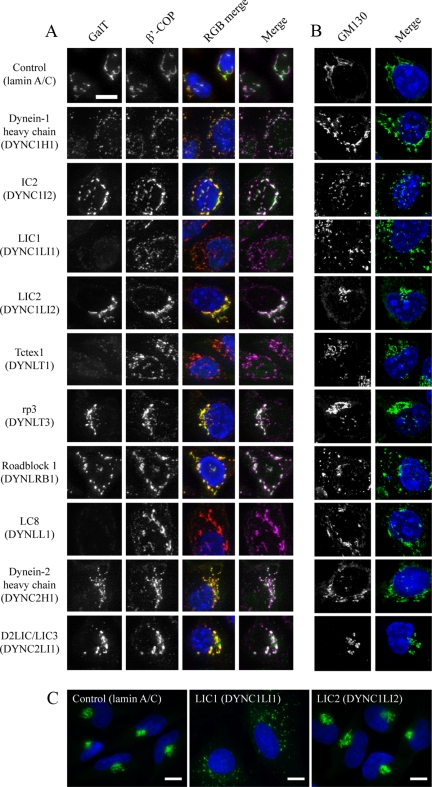
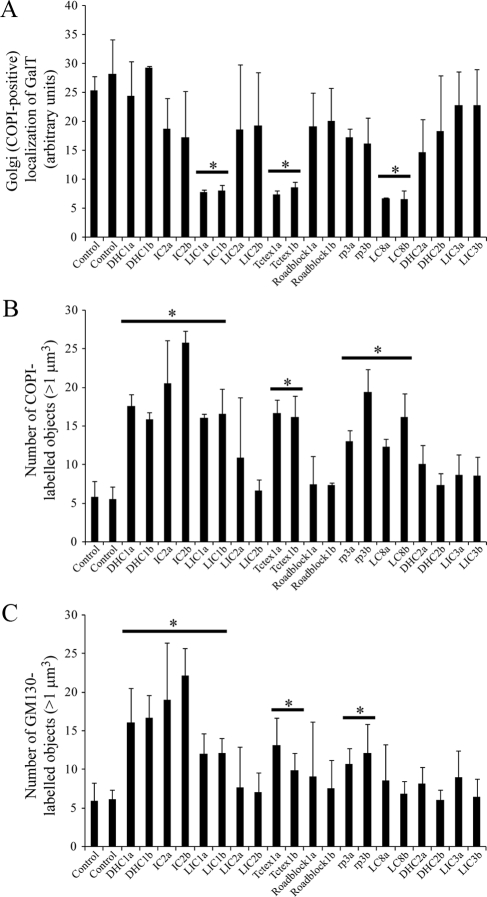
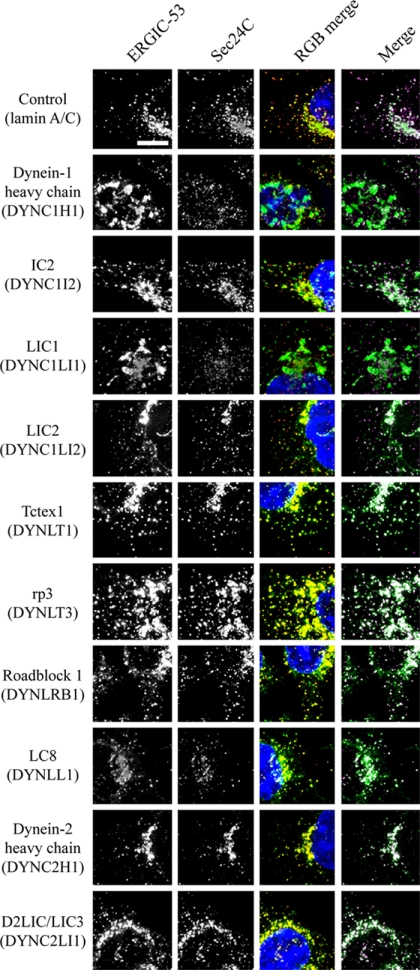
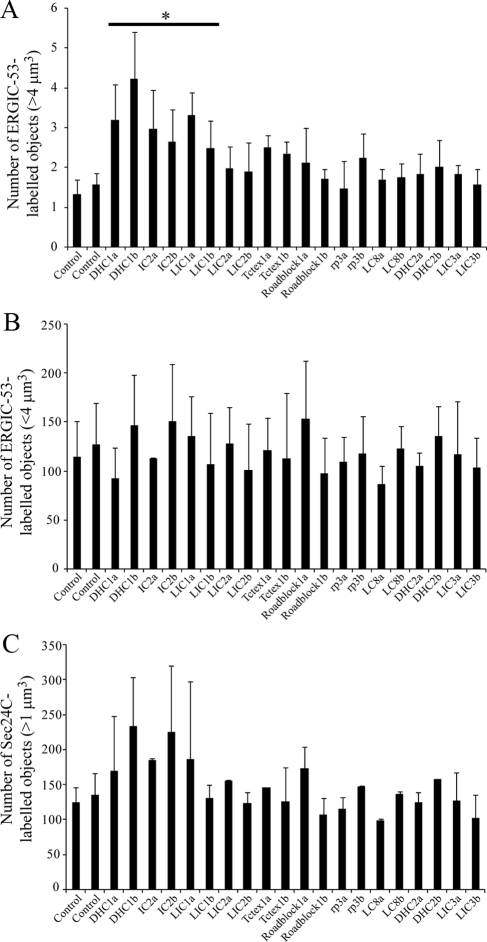
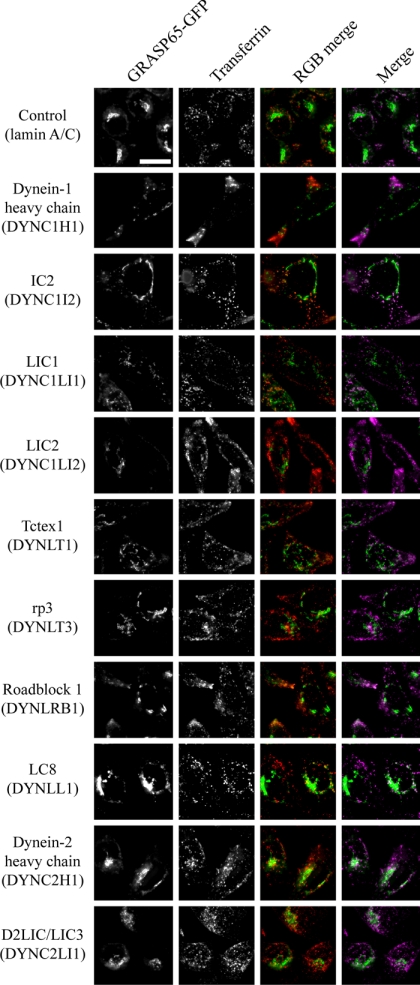
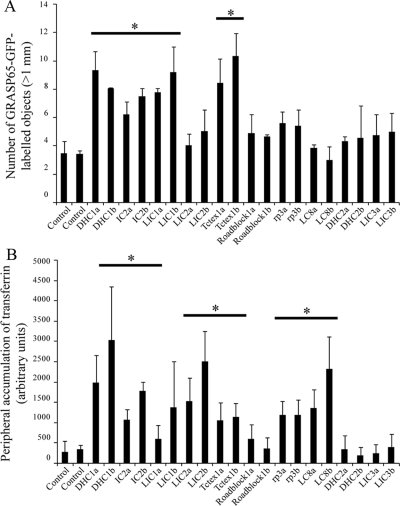
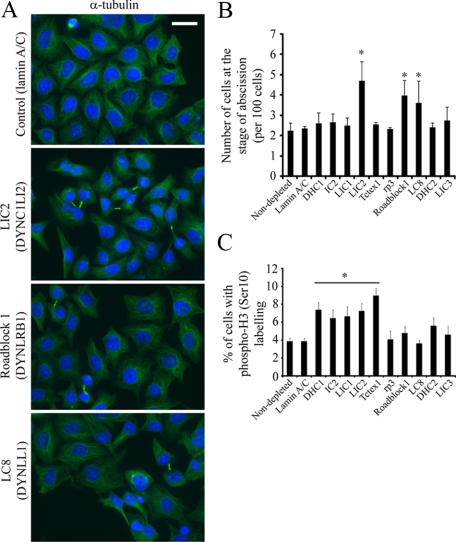
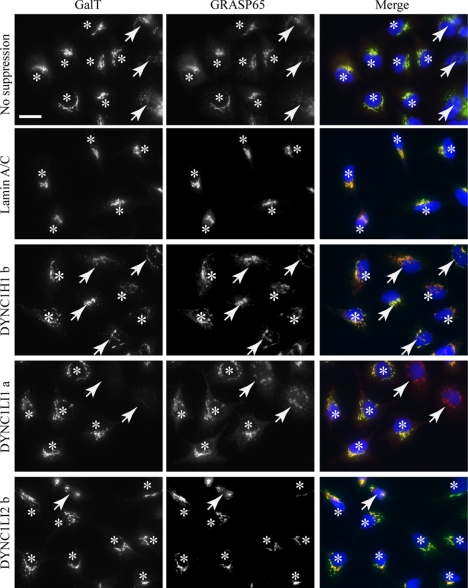
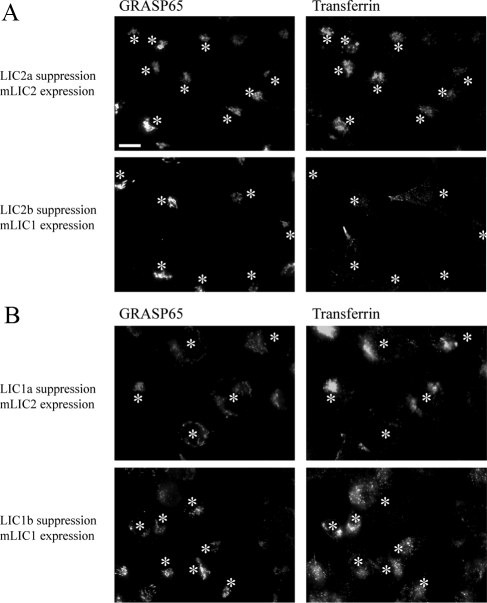
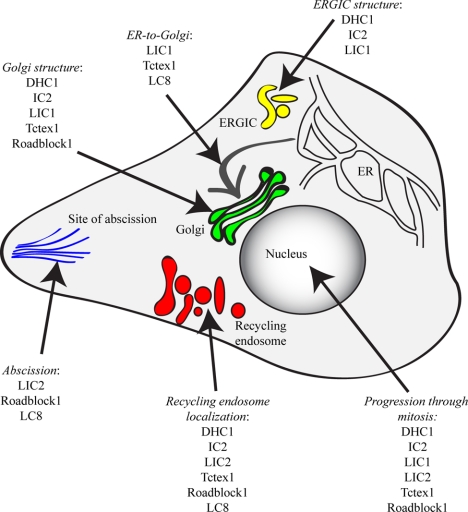
The cytoplasmic dynein motor complex is known to exist in multiple forms, but few specific functions have been assigned to individual subunits. A key limitation in the analysis of dynein in intact mammalian cells has been the reliance on gross perturbation of dynein function, e.g., inhibitory antibodies, depolymerization of the entire microtubule network, or the use of expression of dominant negative proteins that inhibit dynein indirectly. Here, we have used RNAi and automated image analysis to define roles for dynein subunits in distinct membrane-trafficking processes. Depletion of a specific subset of dynein subunits, notably LIC1 (DYNC1LI1) but not LIC2 (DYNC1LI2), recapitulates a direct block of ER export, revealing that dynein is required to maintain the steady-state composition of the Golgi, through ongoing ER-to-Golgi transport. Suppression of LIC2 but not of LIC1 results in a defect in recycling endosome distribution and cytokinesis. Biochemical analyses also define the role of each subunit in stabilization of the dynein complex; notably, suppression of DHC1 or IC2 results in concomitant loss of Tctex1. Our data demonstrate that LIC1 and LIC2 define distinct dynein complexes that function at the Golgi versus recycling endosomes, respectively, suggesting that functional populations of dynein mediate discrete intracellular trafficking pathways.


Figures

Figure 1.
Figure 1.
Suppression of dynein subunit expression using siRNA. Immunoblots show control suppression of lamin A/C from the same experiment, GAPDH as a loading control and the results of transfection with two independent duplexes targeting (A) dynein-1 heavy chain (DYNC1H1), (B) IC2 (DYNC1I2), (C) LIC1 (DYNC1LI1) and LIC2 (DYNC1LI2), (D) Tctex1 (DYNLT1) and rp3 (DYNLT3), (E) LC8 (DYNLL1), and (F) dynein-2 heavy chain (DYNC2H1). Inclusion of duplexes targeting isoforms that are not expressed in these cells provides an additional control and reinforces the specificity of our knockdowns.
Figure 2.
Figure 2.
Effects of dynein subunit suppression on dynein integrity. (A–H) Immunoblots show the expression of (A) GAPDH, (B) p50dynamitin, (C) DHC1, (D) IC2, (E) LIC1, (F) LIC2, (G) LC8, and (H) Tctex in lysates from HeLa cells transfected with siRNA duplexes directed against target proteins as indicated. (I–L) Fractions from 5 to 40% sucrose density gradients from cells depleted of (I) lamin A/C, (J) DHC1, (K) LIC1, or (L) LIC2 were immunoblotted for GAPDH, p50dynamitin, DHC1, IC2, LIC1, or LIC2 as indicated. Fraction 4 corresponds to 19S as judged by thyroglobulin sedimentation.
Figure 3.
Figure 3.
Effect of dynein subunit suppression on Golgi organization and function. (A) Cells depleted of targets as indicated were immunolabeled with antibodies to detect (A) GalT and β′-COP or (B) GM130. RGB and magenta/green merges show, respectively, GalT in green, with β′-COP in red or magenta. Symbols indicated where GalT localization (Golgi transport) or the integrity of the Golgi itself (Golgi structure) is (plus) or is not (minus) perturbed. Nuclei were labeled with DAPI (blue). Panels show enlargements from entire fields of view shown in Supplementary Figures S2 and S4. (C) Immunofluorescence labeling of cells depleted of lamin A/C, LIC1, or LIC2 with anti-giantin antibodies. Images in C were acquired with a 60× objective. Bar (all panels), 10 μm.
Figure 4.
Figure 4.
Quantification of disruption of Golgi architecture. Cells depleted of individual dynein subunits using one of two different siRNA duplexes (denoted a and b) were analyzed by automated object analysis as described in Materials and Methods. (A) The localization of GalT was quantified by detecting COPI-labeled structures based on intensity and measuring the intensity of GalT labeling within these areas. (B and C) Histograms showing the number of Golgi particles (>1 μm3) labeled with antibodies to detect (B) COPI or (C) GM130. Error bars, SD; statistical significance, *p < 0.05.
Figure 5.
Figure 5.
Effect of dynein subunit suppression on ERES (COPII) and the ERGIC. Cells depleted of targets as indicated were immunolabeled with antibodies to detect ERGIC-53 (green) and Sec24C (red, a core component of the COPII coat and marker of ERES). RGB and magenta/green merges show, respectively, ERGIC-53 in green, with Sec24C in red or magenta. Panels show enlargements from entire fields of view shown in Supplementary Figure S5. Bar (all panels), 10 μm.
Figure 6.
Figure 6.
Quantification of disruption of ERGIC structures and ERES. Cells depleted of individual dynein subunits using one of two different siRNA duplexes (denoted a and b) were analyzed by automated object analysis as described in Materials and Methods. (A) Histogram showing total number of ERGIC-53–positive structures <4 μm3. (B) Histogram showing the total number of ERGIC-53–positive structures >4 μm3. (C) Histogram showing the total number of Sec24C-labeled objects >1 μm3. Error bars, SD; statistical significance, *p < 0.05.
Figure 7.
Figure 7.
Effect of dynein subunit suppression on Golgi architecture and transferrin uptake in living cells. Cells stably expressing GRASP65-GFP (green) were depleted of targets as indicated and loaded with AlexaFluor-568-transferrin (red) for 1 h at 37°C followed by imaging also at 37°C. At this time AlexaFluor-568-transferrin labels a significant intracellular pool with little peripheral labeling in controls; peripheral accumulation indicates a defect in centripetal translocation of transferrin-positive endosomes. Symbols indicate where depletion of individual subunits does (plus) or does not (minus) result in peripheral accumulation of transferrin-positive endosomes. Panels show enlargements from entire fields of view shown in Supplementary Figure S6. Bar (all panels), 10 μm.
Figure 8.
Figure 8.
Quantification of localization of transferrin-positive endosomes. Cells depleted of individual dynein subunits using one of two different siRNA duplexes (denoted a and b) were analyzed by automated object analysis as described in Materials and Methods. (A) The number of GRASP65-GFP–labeled Golgi structures (>1 μm3) was counted based on intensity thresholding. (B) The area covered by peripherally localized transferrin-positive endosomes was counted. Error bars, SD; statistical significance, *p < 0.05.
Figure 9.
Figure 9.
LIC2 (DYNC1LI2) and LC8 (DYNLL1) are required for the completion of abscission during cytokinesis. (A) Cells depleted of dynein subunits were processed for immunofluorescence using antibodies to detect α-tubulin (green in right column); cells were counterstained with DAPI to visualize cell nuclei (blue). Bar (all panels), 20 μm. (B) Images were scored by visual inspection for numbers of cells at the stage of abscission (intercellular tubulin bridges) and are expressed as a percentage of cells analyzed (>200 cells from three independent experiments). Error bars, SD, asterisks indicate statistically discernable differences; only LIC2 (DYNC1LI2, p = 0.004), Roadblock1 (DYNLRB1, p = 0.007), and LC8 (DYNLL1, p = 0.04) show statistically detectable differences to lamin sA/ C–depleted controls. (C) Cells depleted of dynein subunits were fixed and immunolabeled to detect phospho-histone H3 (Serine-10). Error bars, SD; asterisk and horizontal bar indicate statistical significance: DHC1 (DYNC1H1) p = 0.002, IC2 (DYNC1I1) p = 0.01, LIC1 (DYNC1LI1) p = 0.01, LIC2 (DYNC1LI2) p = 0.004, Tctex1 (DYNLT1) p = 0.01, and Roadblock1 (DYNLRB1) p = 0.03.
Figure 10.
Figure 10.
Rescue of LIC1 suppression by mLIC1 expression. Cells were suppressed for LIC1 followed by transfection with a plasmid encoding mLIC1. Asterisks indicate expressing cells (as adjudged by LIC1 immunofluorescence), and arrows indicate cells that were not detectably expressing mLIC1 above background. Note that suppression of DHC1 causes Golgi fragmentation that is not rescued by mLIC1 suppression. Golgi fragmentation in LIC1 suppressed cells is effectively rescued by expression of mLIC1. Bar (all panels), 20 μm.
Figure 11.
Figure 11.
Rescue of LIC2 suppression by mLIC2 expression. Cells were suppressed by siRNA transfection and subsequently with plasmids encoding either mLIC1 or mLIC2 as indicated. After incubation with AlexaFluor-568-transferrin for 60 min, cells were extensively washed, fixed, and immunolabeled to detect GRASP65 and mLICs. Asterisks indicate mLIC-expressing cells. (A) The peripheral distribution of transferrin endosomes in LIC2 suppressed cells is rescued by mLIC2 expression but not by mLIC1 expression. (B) Golgi fragmentation caused by LIC1 suppression is rescued by mLIC1 but not mLIC2 expression. Bar (all panels), 20 μm.
Figure 12.
Figure 12.
Summary model of the roles for dynein subunits identified in this study. The summary is compiled from the quantitative imaging data and is designed to highlight the most prominent of the phenotypes that we observe. All steps require the dynein heavy chain (DHC1 subunit) and IC (IC2 subunit) because these are required for complex assembly, but we do not always observe strong phenotypes in our assays after suppression of these subunits, which is most likely due to incomplete suppression of expression. These data are also summarized in Table 1.

Comment in

  • Mol Biol Cell. 20:2809.

References

    1. Aniento F., Emans N., Griffiths G., Gruenberg J. Cytoplasmic dynein-dependent vesicular transport from early to late endosomes. J. Cell Biol. 1993;123:1373–1387. - PMC - PubMed
    1. Barbar E. Dynein light chain LC8 is a dimerization hub essential in diverse protein networks. Biochemistry. 2008;47:503–508. - PubMed
    1. Benison G., Karplus P. A., Barbar E. Structure and dynamics of LC8 complexes with KXTQT-motif peptides: swallow and dynein intermediate chain compete for a common site. J. Mol. Biol. 2007;371:457–468. - PubMed
    1. Bielli A., Thornqvist P. O., Hendrick A. G., Finn R., Fitzgerald K., McCaffrey M. W. The small GTPase Rab4A interacts with the central region of cytoplasmic dynein light intermediate chain-1. Biochem. Biophys. Res. Commun. 2001;281:1141–1153. - PubMed
    1. Burkhardt J. K., Echeverri C. J., Nilsson T., Vallee R. B. Overexpression of the dynamitin (p50) subunit of the dynactin complex disrupts dynein-dependent maintenance of membrane organelle distribution. J. Cell Biol. 1997;139:469–484. - PMC - PubMed

Publication types

MeSH terms