Comparative Study
. 2009 Apr 22;29(16):5062-74.
doi: 10.1523/JNEUROSCI.0716-09.2009.

Complex intrinsic membrane properties and dopamine shape spiking activity in a motor axon

Affiliations
Comparative Study

Complex intrinsic membrane properties and dopamine shape spiking activity in a motor axon

Aleksander W Ballo et al. J Neurosci. .

Abstract

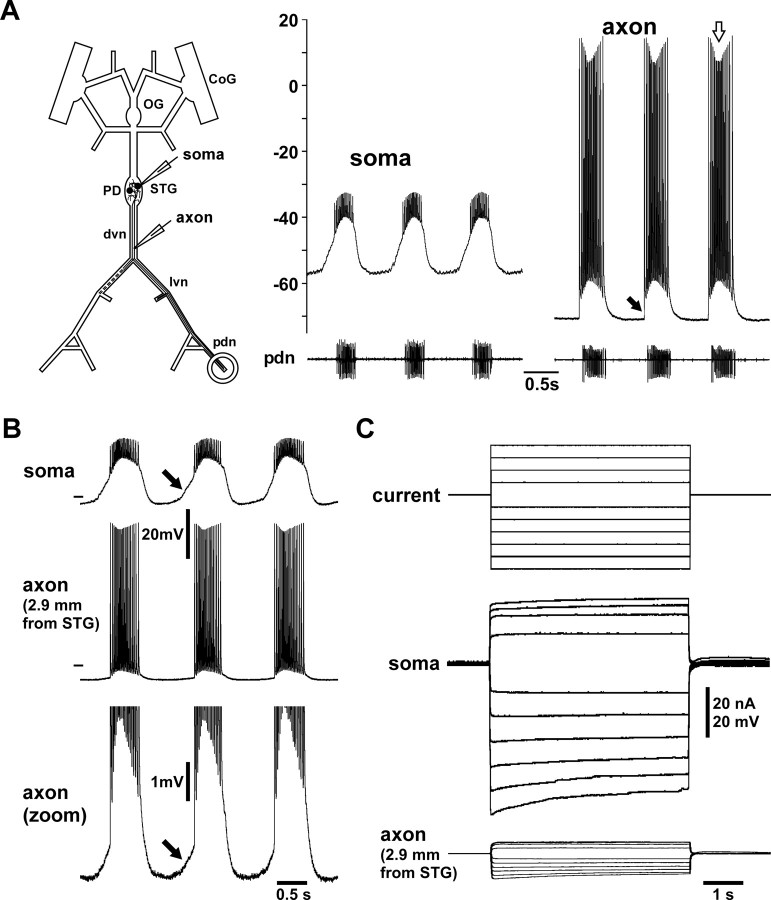
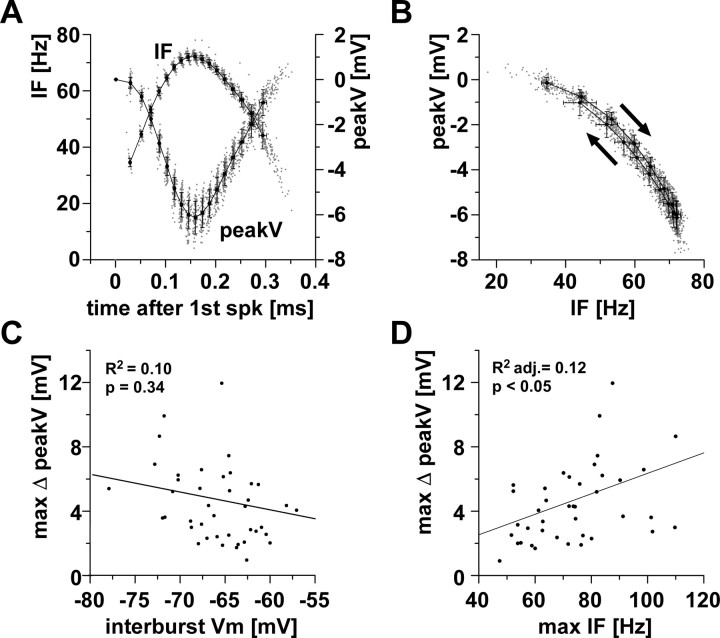
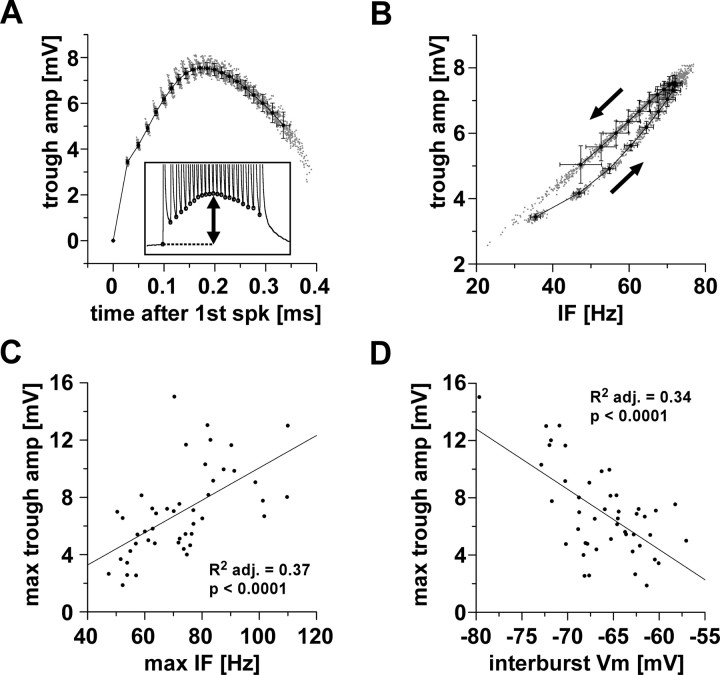
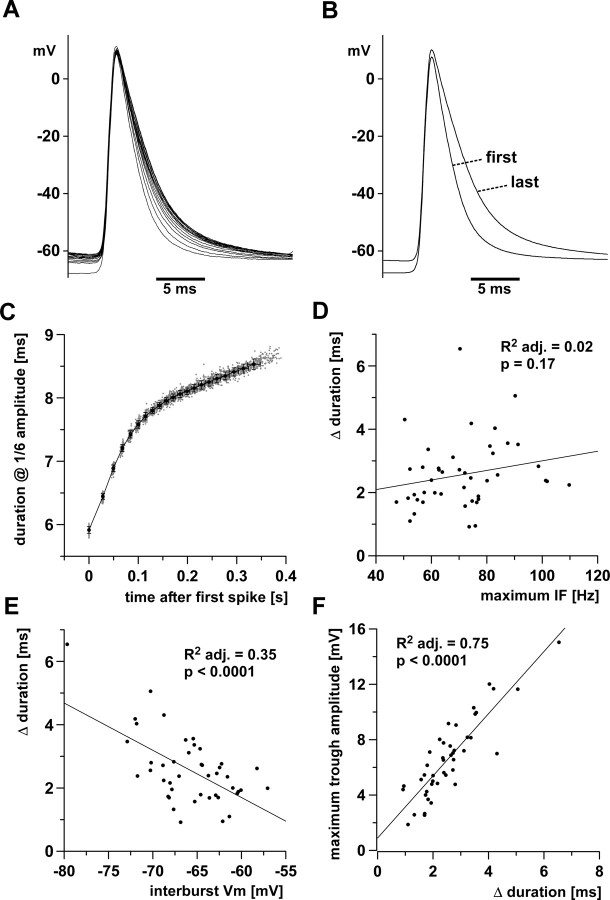
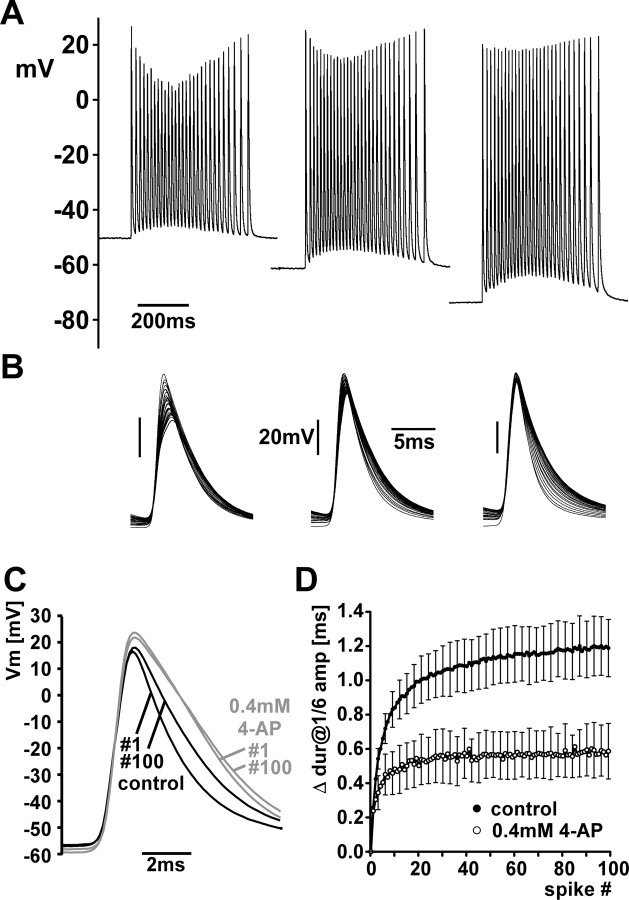
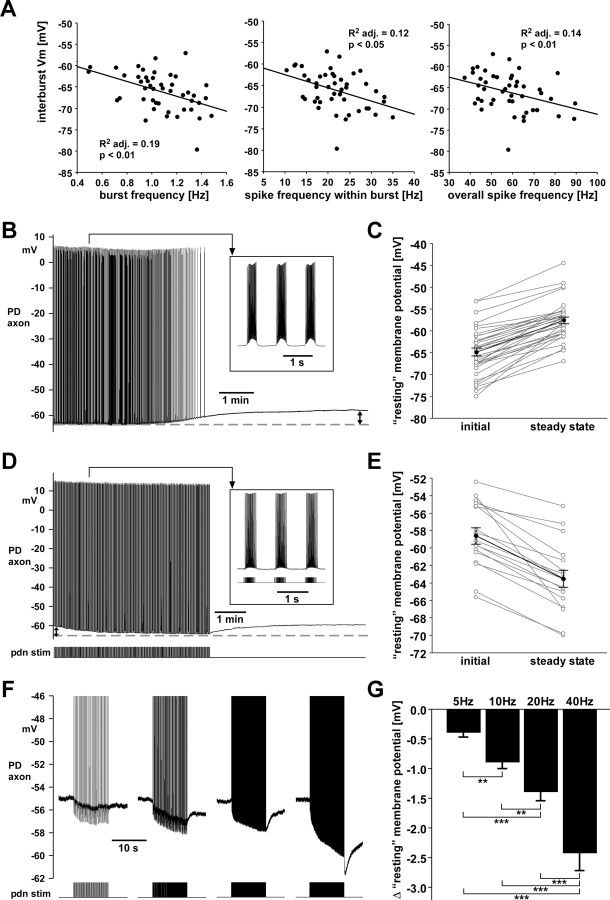
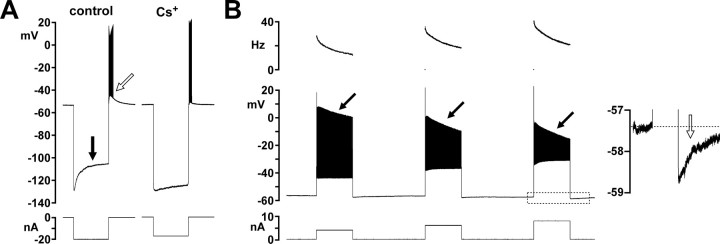
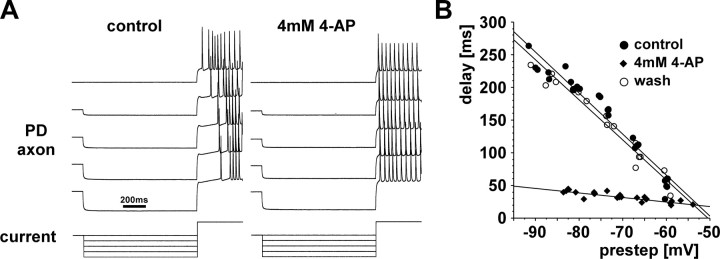
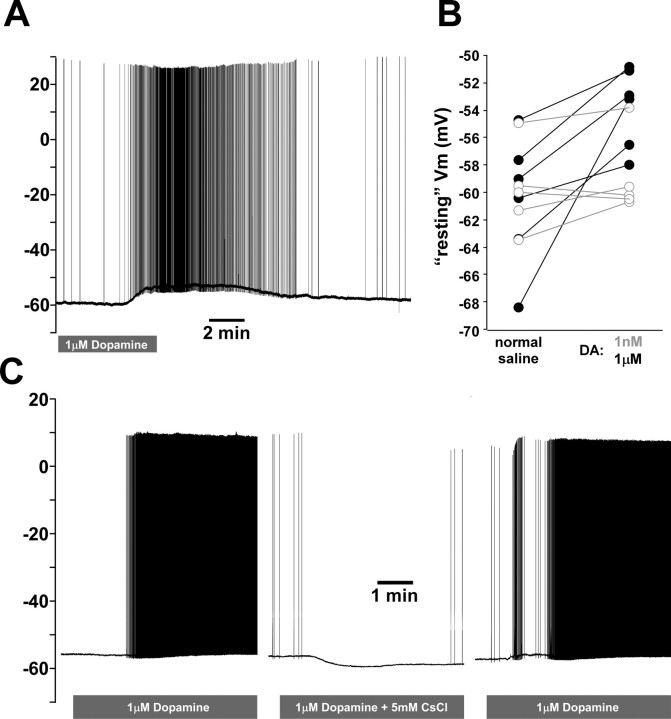
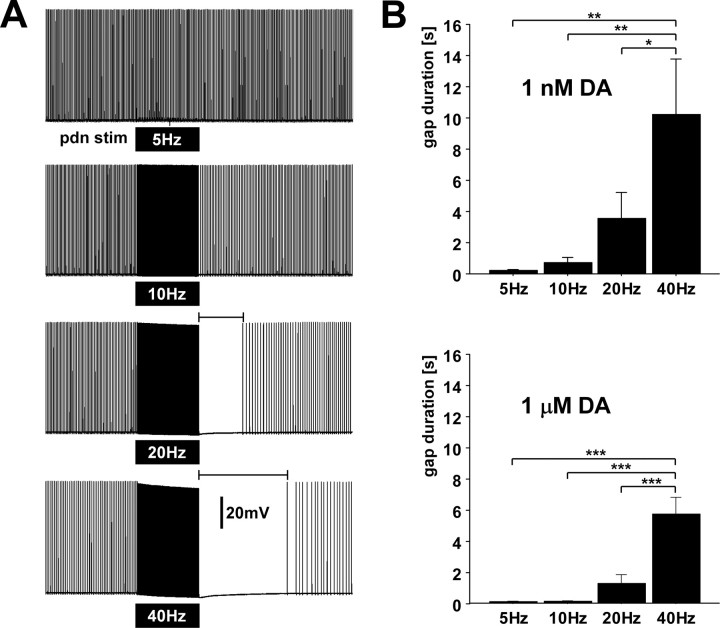
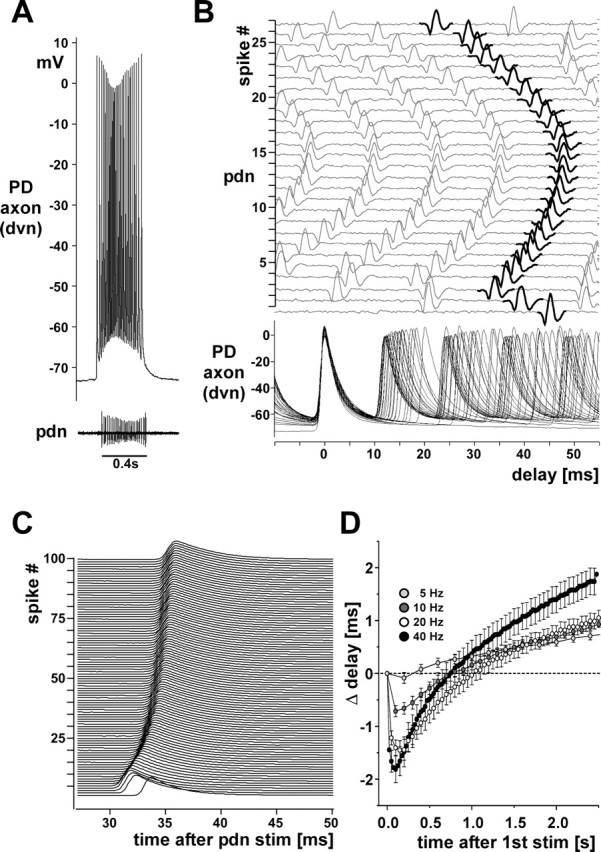
We studied the peripheral motor axons of the two pyloric dilator (PD) neurons of the stomatogastric ganglion in the lobster, Homarus americanus. Intracellular recordings from the motor nerve showed both fast and slow voltage- and activity-dependent dynamics. During rhythmic bursts, the PD axons displayed changes in spike amplitude and duration. Pharmacological experiments and the voltage dependence of these phenomena suggest that inactivation of sodium and A-type potassium channels are responsible. In addition, the "resting" membrane potential was dependent on ongoing spike or burst activity, with more hyperpolarized values when activity was strong. Nerve stimulations, pharmacological block and current clamp experiments suggest that this is due to a functional antagonism between a slow after-hyperpolarization (sAHP) and inward rectification through hyperpolarization-activated current (IH). Dopamine application resulted in modest depolarization and "ectopic" peripheral spike initiation in the absence of centrally generated activity. This effect was blocked by CsCl and ZD7288, consistent with a role of IH. High frequency nerve stimulation inhibited peripheral spike initiation for several seconds, presumably due to the sAHP. Both during normal bursting activity and antidromic nerve stimulation, the conduction delay over the length of the peripheral nerve changed in a complex manner. This suggests that axonal membrane dynamics can have a substantial effect on the temporal fidelity of spike patterns propagated from a spike initiation site to a synaptic target, and that neuromodulators can influence the extent to which spike patterns are modified.


Figures

Figure 1.
Figure 1.
Intracellular PD axon recordings from peripheral nerve. A, Intracellular recordings of the PD soma and axon along with extracellular recording from the pdn during ongoing rhythmic pyloric activity. The schematic of the stomatogastric nervous system indicates the somatic and axonal recording sites. The soma recording shows attenuated spikes, whereas the axonal recording shows overshooting spikes. Spike amplitudes change over the course of the burst (white arrow) and ride on top of a baseline depolarization that starts abruptly with the first spike (black arrow). B, Simultaneous intracellular recordings from the soma and axon. The axon recording is from a site more proximal to the STG than used for the rest of this study. The bottom showing only the voltage range around the baseline of the axon recording reveals a slow depolarization that likely represents the attenuated remnant of the slow-wave oscillation seen in the soma recording (black arrows). C, Voltage attenuation from soma to axon. In the same experiment as shown in B, centrally generated activity was blocked and the soma penetrated with a second electrode. Steps of depolarizing and hyperpolarizing current injections show that voltage responses were substantially attenuated in the axon.
Figure 2.
Figure 2.
Activity-dependent changes in spike peak voltage. A, Peak voltage and instantaneous spike frequency as a function of time over the course of a burst. Data are from 100 bursts in a single experiment. Single data points are superimposed with mean values sorted by spike index (±SD in x and y). spk, Spike. B, Peak voltage plotted as a function of instantaneous spike frequency, from the same data as in A. Mean values show slight differences for the first (right arrow) and second (left arrow) halves of the burst. C, Across experiments, the maximum difference in spike peak voltage was not dependent on the interburst membrane potential (Vm). D, Across experiments, the maximum difference in spike peak voltage was dependent on the maximum instantaneous spike frequency. IF, Instantaneous spike frequency; adj., adjusted; max, maximum.
Figure 3.
Figure 3.
Baseline depolarization over the course of the burst. A, Trough amplitude as a function of time over the course of a burst. The inset indicates that trough amplitude was obtained as the difference between voltage minima between spikes and the resting membrane potential. Data are from 100 bursts in a single experiment. Single data points are superimposed with mean values sorted by spike index (±SD in x and y). spk, Spike. B, Trough amplitude plotted as a function of instantaneous spike frequency, from the same data as in A. Average values show slight differences for the first (lower arrow) and second half of the burst (upper arrow). C, D, Across experiments, the maximum trough amplitude was dependent on the maximum instantaneous spike frequency and the interburst membrane potential. amp, Amplitude; IF, instantaneous spike frequency; Vm, membrane potential; adj., adjusted; max, maximum.
Figure 4.
Figure 4.
Increase in spike duration over the course of the burst. A, Multiple sweeps of all spikes in a single burst, aligned at the peak. B, Averaged traces of the first and last spike from 100 bursts. C, Spike duration at 1/6 of the amplitude of the first spike from 100 bursts in a single experiment. Single data points are superimposed with mean values sorted by spike index (±SD in x and y). D, Across experiments, the change in spike duration was not dependent on the maximum instantaneous spike frequency. E, Across experiments, the change in spike duration was dependent on the interburst membrane potential (Vm). F, Across experiments, the baseline depolarization under the burst maximum trough amplitude) was dependent on the increase in spike duration. adj., Adjusted.
Figure 5.
Figure 5.
Changes in spike shape are likely due to channel inactivation. A, Bursts from a PD axon recording at three different interburst membrane potentials set by current injection through a second electrode. The change in spike amplitude is more pronounced at more depolarized potentials. B, Multiple sweeps from the bursts shown in A. The change in spike duration is more pronounced at more hyperpolarized potentials. C, The 1st and 100th spike from a PD axon recording in response to 20 Hz stimulation of the pdn, in control saline and 0.4 mm 4-AP. In 4-AP, duration was increased but did not change as much between 1st and 100th spike. Vm, Membrane potential. D, The increase of spike duration as a function of spike index in control saline (black) and 4-AP (gray). dur, Duration; amp, amplitude.
Figure 6.
Figure 6.
The interburst membrane potential is dependent on the strength of bursting activity. A, Across experiments, the interburst membrane potential (Vm) was dependent on burst frequency, spike frequency within the burst, and overall spike frequency (spikes/cycle). B, PD axon recording showing depolarization in response to blocking centrally generated activity. adj., Adjusted. C, Change in “resting” membrane potential across experiments. Individual experiments are shown in gray, and mean data points (±SEM) in black. The difference between means was significant (paired t test; p < 0.0001; n = 35). D, PD axon recording with centrally generated activity blocked, showing hyperpolarization in response to stimulation of the pdn mimicking pyloric bursting activity. E, Change in “resting” membrane potential across experiments. Individual experiments are shown in gray, and mean data points (±SEM) in black. The difference between means was significant (paired t test; p < 0.0001; n = 17). F, PD axon recordings showing the response to stimulating the pdn with 10 s trains at 5, 10, 20, and 40 Hz. G, Hyperpolarization in response to stimulation was dependent on frequency (repeated-measures ANOVA, p < 0.0001; Fisher's PLSD post hoc, p values between 0.004 and <0.0001). stim, Stimulation.
Figure 7.
Figure 7.
Intrinsic membrane properties of the PD axon, tested in two-electrode current clamp in the absence of centrally generated activity. A, Depolarizing sag potential (black arrow) and rebound depolarization (white arrow) in response to hyperpolarizing current injection. The sag potential substantially reduced by CsCl, but the rebound to some degree persists. B, Spike frequency adaptation and sAHP in response to depolarizing current injections. The top panel shows the instantaneous spike frequency for each spike. Black arrows indicate the reduction in spike amplitude. The inset shows the sAHP (white arrow) from the voltage and time range indicated in the response to the third square pulse (dashed box).
Figure 8.
Figure 8.
Sensitivity of the voltage-dependent rebound delay to 4-AP. A, Two-electrode current clamp records of the PD axon's responses to depolarizing steps after hyperpolarizing presteps of different amplitude. The resting membrane potential was held at −60 mV, stepped to various hyperpolarized potentials up to −90 mV for 1 s, and then to −40 mV. In control saline, more hyperpolarized presteps lead to larger delays in the onset of spiking. In 4-AP, this delay is substantially reduced. B, Plots of delay over the prestep potential for the same experiment shown in A, for control saline, 4-AP, and after 30 min wash.
Figure 9.
Figure 9.
Dopamine-induced depolarization of the PD axon. A, PD axon recording showing a slow depolarizing response to bath application of 1 μm dopamine. Centrally generated activity was blocked. B, “Resting” membrane potential (Vm) between control saline and dopamine for different experiments (open circles/gray, 1 nm; closed circles/black, 1 μm). C, PD axon recording showing that 1 μm dopamine elicited spikes on its own, but failed to do so in the presence of CsCl. After CsCl was washed, dopamine elicited spikes again.
Figure 10.
Figure 10.
High frequency spiking suppresses dopamine elicited peripheral spike initiation. A, PD axon recording in the absence of centrally generated activity and the presence of 1 μm dopamine. Black boxes indicate timing of 10 s trains of pdn stimulations at different frequencies. stim, Stimulation. B, Quantification of the interval from the last stimulus to the first spike afterward for different stimulus frequencies in both dopamine concentrations.
Figure 11.
Figure 11.
Changes in conduction delay. A, A single burst from a PD axon recording in an experiment in which the other PD neuron signal was missing on one of the pdns. B, Multiple sweeps of the recordings shown in A. Traces are aligned at the peaks of the intracellular spikes. Sweeps of the pdn recording are plotted with an offset and in order, with the extracellular spikes that correspond to the intracellular ones shown in black. Note the change of delay over the course of a single burst. C, Offset multiple sweeps from an intracellular PD axon recording during a 40 Hz extracellular stimulation of the pdn. One hundred stimuli are shown aligned at the pdn stimulus time. Delay initially decreases and then increases. D, Plot of the change in conduction delay over 2.5 s of pdn stimulations with 5, 10, 20, and 40 Hz (n = 28). stim, Stimulation.

Similar articles

Cited by

References

    1. Aizenman CD, Linden DJ. Regulation of the rebound depolarization and spontaneous firing patterns of deep nuclear neurons in slices of rat cerebellum. J Neurophysiol. 1999;82:1697–1709. - PubMed
    1. Armett CJ, Ritchie JM. The action of acetylcholine on conduction in mammalian non-myelinated fibres and its prevention by an anticholinesterase. J Physiol. 1960;152:141–158. - PMC - PubMed
    1. Armett CJ, Ritchie JM. The action of acetylcholine and some related substances on conduction in mammalian non-myelinated nerve fibres. J Physiol. 1961;155:372–384. - PMC - PubMed
    1. Baker M, Bostock H, Grafe P, Martius P. Function and distribution of three types of rectifying channel in rat spinal root myelinated axons. J Physiol. 1987;383:45–67. - PMC - PubMed
    1. Baker MD. Axonal flip-flops and oscillators. Trends Neurosci. 2000;23:514–519. - PubMed

Publication types

LinkOut - more resources