Comparative Study
. 2009 Apr 22;29(16):5088-99.
doi: 10.1523/JNEUROSCI.6175-08.2009.

Organization of intralaminar and translaminar neuronal connectivity in the superficial spinal dorsal horn

Affiliations
Comparative Study

Organization of intralaminar and translaminar neuronal connectivity in the superficial spinal dorsal horn

Go Kato et al. J Neurosci. .

Abstract

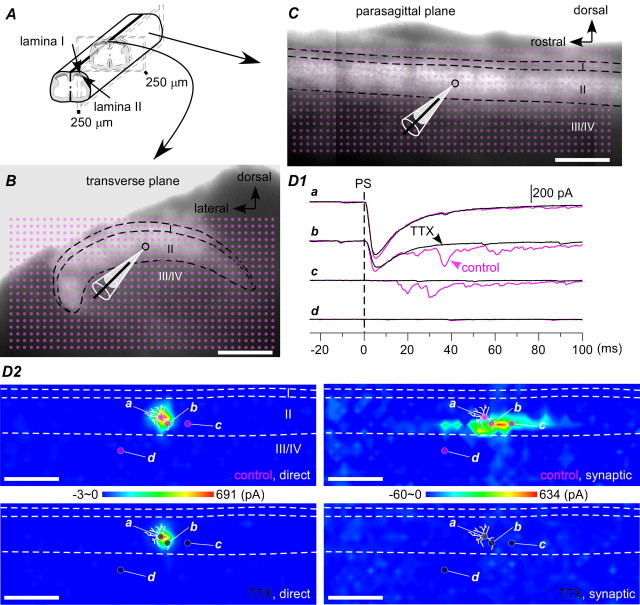
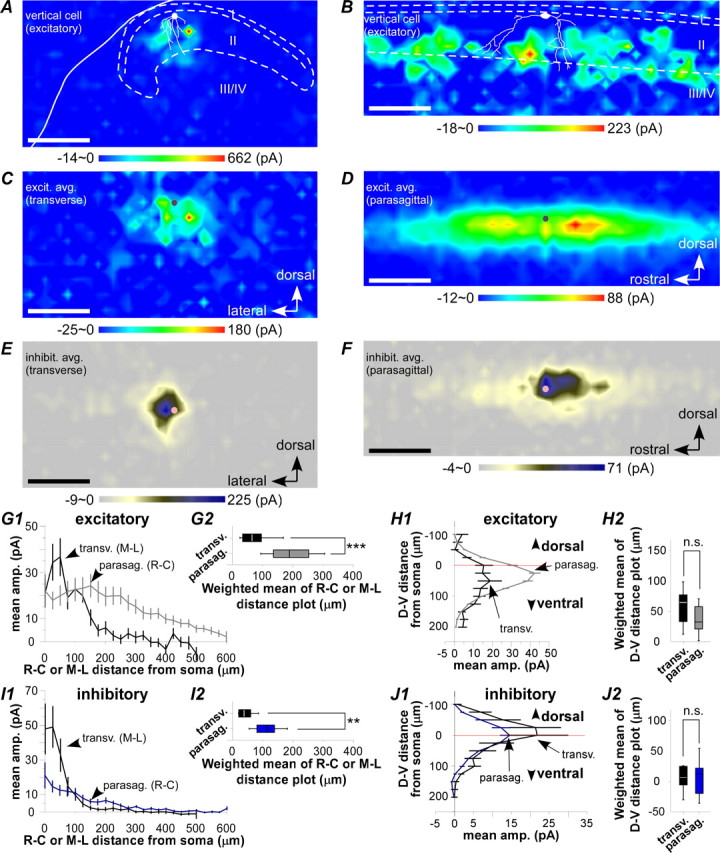
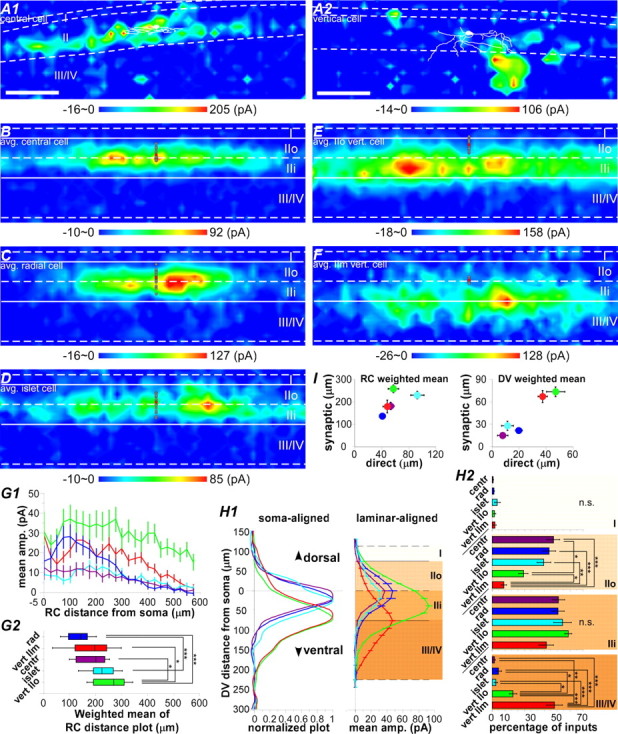
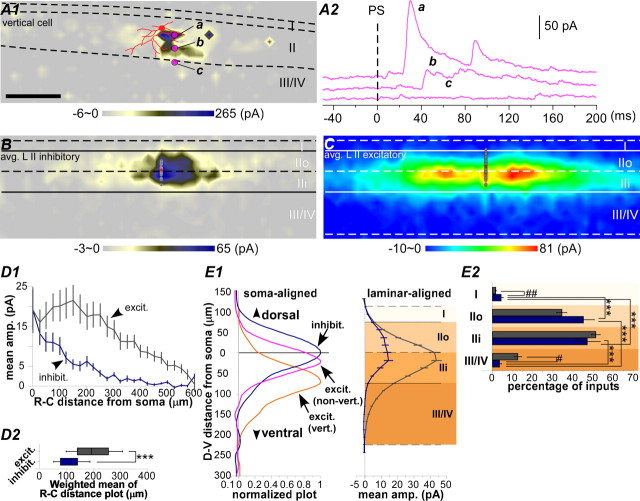
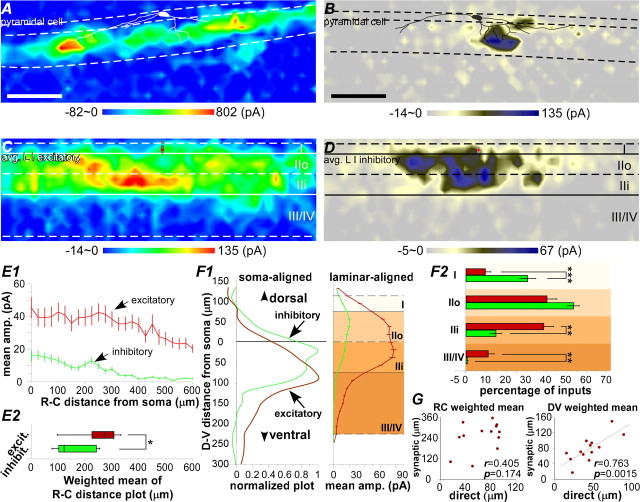
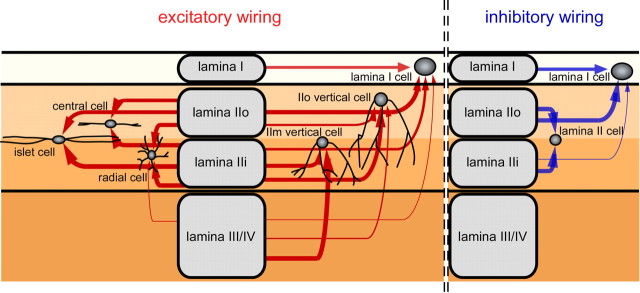
The spinal dorsal horn exhibits a high degree of intrinsic connectivity that is critical to its role in the processing of nociceptive information. To examine the spatial organization of this intrinsic connectivity, we used laser-scanning photostimulation in parasagittal and transverse slices of lumbar spinal cord to stimulate presynaptic neurons by glutamate uncaging, and mapped the location of sites that provide excitatory and inhibitory synaptic input to neurons of the superficial laminae. Excitatory interneuronal connectivity within lamina II exhibited a pronounced sagittal orientation, in keeping with the somatotopic organization present in the pattern of primary afferent projections. Excitatory inputs to all classes of lamina II neurons arose from a wider rostrocaudal area than inhibitory inputs, whereas both excitatory and inhibitory input zones were restricted mediolaterally. Lamina I-II neurons exhibited cell type-specific patterns in the laminar distribution of their excitatory inputs that were related to their dorsoventral dendritic expanse. All cell types received excitatory input predominantly from positions ventral to that of their soma, but in lamina I neurons and lamina II vertical cells this ventral displacement of the excitatory input zone was greater than in the other cell types, resulting in a more pronounced translaminar input pattern. A previously unknown excitatory input to the superficial dorsal horn from lamina III-IV was identified in a subset of the vertical cell population. These results reveal a specific three-dimensional organization in the local patterns of excitatory and inhibitory connectivity that has implications for the processing of information related to both somatotopy and sensory modality.


Figures

Figure 1.
Figure 1.
Illustration of photostimulation (PS) grids in transverse and parasagittal slices, and identification of direct versus synaptically evoked responses. Diagram (A) and IR-DIC images (B, C) of transverse and parasagittal spinal cord slice preparations. The purple dots in B and C indicate the PS scanning grids used for mapping of sites that evoke synaptic responses (800 sites in a 20 × 40 array for transverse, 768 sites in a 16 × 48 array for parasagittal, with 25 μm spacing). The black circles in B and C indicate the position of the soma of the recorded neuron. D1, D2, Identification of direct versus synaptic responses based on TTX sensitivity. D1 shows the responses evoked by photostimulation at the four sites (a–d) indicated in the maps in D2, recorded in a radial cell in the presence (black traces) and absence (purple traces) of TTX. TTX blocked late (>6 ms delay) but not early responses. Direct and synaptic responses were therefore determined using response time windows of 0–5 and 6–106 ms, respectively (Kato et al., 2007). In D2, the top and bottom left maps show that direct responses were TTX-resistant, whereas the top and bottom right maps show that synaptic responses were blocked by TTX. Stimulation at the soma (site a) evoked a large direct response, whereas stimulation at the dendritic site b evoked a mixture of direct and synaptic (EPSCs) responses, indicating the presence of a presynaptic partner at this site. Stimulation away from the dendritic sites evoked a purely synaptic response (site c) or no significant increase above spontaneous activity (site d), indicating the presence or absence of presynaptic partners at those respective sites. Maps were constructed from the sum of the peak amplitudes of the inward currents. Holding potential, −70 mV. Scale bars, 200 μm.
Figure 2.
Figure 2.
Comparison of excitatory and inhibitory synaptic input zones (sites that evoke EPSCs or IPSCs, respectively) of lamina II neurons mapped in the transverse and parasagittal planes. A, B, Examples of transverse (A) and parasagittal (B) maps of excitatory input zones for two lamina II vertical cells. C–F, Averaged transverse (C) (n = 8) and parasagittal (D) (n = 106) maps of excitatory input zones, and transverse (E) (n = 5) and parasagittal (F) (n = 19) maps of inhibitory input zones, for all lamina II neurons. For averaging, maps of individual neurons were aligned by soma location (C–F, gray circles). G1, Plots of mean response amplitude versus mediolateral (black) and rostrocaudal (gray) distance from the soma as measured from averaged transverse and parasagittal maps of excitatory input zones, respectively. G2, Box plots of the mean distance of the input zone from the soma, as measured along the mediolateral and rostrocaudal axes (calculated as the weighted mean of the plots in G1). H1, H2, Same plots as G1, G2, but in the dorsoventral direction, obtained from both transverse (black) and parasagittal (gray) planes. I1, Plots of mean response amplitudes versus mediolateral (black) and rostrocaudal (navy) distance from the soma as measured from averaged transverse and parasagittal maps of inhibitory input zones, respectively. I2, Box plots of the mean distance of the input zone from the soma, as measured along the mediolateral and rostrocaudal axes (calculated as the weighted mean of the plots in I1). J1, J2, Same plots as I1 and I2 but in the dorsoventral direction, obtained from both transverse (black) and parasagittal (navy) planes.
Figure 3.
Figure 3.
Comparison of excitatory input zones for different classes of lamina II neurons. A1, A2, Examples of excitatory synaptic input maps for a lamina II central cell and vertical cell, respectively. B–F, Averaged excitatory synaptic input maps for lamina II central (n = 16), radial (n = 28), islet (n = 16), vertical IIo (n = 19), and vertical IIm (n = 11) cells. For averaging, maps from individual neurons were aligned rostrocaudally by soma location and dorsoventrally by the borders of lamina II (white solid lines) (whereas averaged maps in Fig. 2 were aligned dorsoventrally by the soma). The gray and red circles mark the individual and averaged soma locations, respectively. G1, G2, Rostrocaudal distribution of excitatory input zones for the same five groups of lamina II neurons shown in the maps in B–F. G1, Plots of mean amplitude versus rostrocaudal distance from the soma. G2, Mean rostrocaudal distance of the input zone from the soma (calculated as the weighted mean of the plots in G1). H, Dorsoventral and laminar distribution of excitatory input zones for the same five groups of lamina II neurons. H1, Plots of mean amplitude versus dorsoventral position, aligned by the soma (left) or the lamina II borders (right); amplitudes were normalized for the soma-aligned plot. H2, Bar graphs of the percentage of total inputs from each laminar region. I, Plots of the weighted mean of the rostrocaudal (left) and dorsoventral (right) distributions for direct versus synaptic excitatory responses. Correlation for dorsoventral, r = 0.96, p = 0.0063; rostrocaudal, r = 0.62, p = 0.30 (n = 5 groups).
Figure 4.
Figure 4.
Inhibitory synaptic zones of lamina II neurons and comparison with excitatory input zones. A1, a, Representative example of a map of the inhibitory input zone for a vertical cell, and b, responses evoked by stimulation at sites a–c. B, Averaged map of the inhibitory input zone for lamina II neurons (n = 19). Individual maps were aligned rostrocaudally by soma location and dorsoventrally by the borders of lamina II (black solid lines). C, Averaged map of the excitatory input zone for lamina II neurons (n = 106). D, Rostrocaudal distribution of inhibitory input zones (navy line) and excitatory input zones (gray line) for lamina II neurons, as illustrated in plots of mean response amplitude versus rostrocaudal distance from the soma (D1) and box plots of the mean rostrocaudal distance of the input zone from the soma (D2, calculated as the weighted mean of the plots in D1). E, Dorsoventral and laminar distribution of inhibitory and excitatory input zones for lamina II neurons. E1, Plots of mean amplitude versus dorsoventral position, aligned by the soma (left) or the lamina II borders (right); amplitudes were normalized for the soma-aligned plot. D2, Bar graphs of the percentage of total inputs from each laminar region.
Figure 5.
Figure 5.
Excitatory and inhibitory input zones of lamina I neurons. Examples of individual maps (A, B) and averaged maps (C, n = 13; D, n = 9) of excitatory and inhibitory input zones, respectively, for lamina I neurons. For averaging, individual maps were aligned rostrocaudally by soma location and dorsoventrally by lamina II borders (solid lines). E, Rostrocaudal distribution of excitatory and inhibitory input zones for lamina I neurons, as illustrated in plots of mean response amplitude versus rostrocaudal distance from the soma (E1) and box plots of the mean rostrocaudal distance of the input zone from the soma (E2) (calculated as the weighted mean of the plots in E1). F, Dorsoventral and laminar distribution of excitatory and inhibitory input zones for lamina I neurons. F1, Plots of mean amplitude versus dorsoventral position, aligned by the soma (left) or the lamina II borders (right); amplitudes were normalized for the soma-aligned plot. F2, Bar graphs of the percentage of total inputs from each laminar region. G, Plots of the weighted mean of the rostrocaudal (left) and dorsoventral (right) distributions for direct versus synaptic excitatory responses. r, Pearson's correlation coefficient.
Figure 6.
Figure 6.
Proposed intralaminar and translaminar patterns of connectivity in the wiring of local excitatory and inhibitory synaptic inputs to superficial dorsal horn neurons.

Similar articles

Cited by

References

    1. Baba H, Doubell TP, Woolf CJ. Peripheral inflammation facilitates A-β fiber-mediated synaptic input to the substantia gelatinosa of the adult rat spinal cord. J Neurosci. 1999;19:859–867. - PMC - PubMed
    1. Baba H, Ji RR, Kohno T, Moore KA, Ataka T, Wakai A, Okamoto M, Woolf CJ. Removal of GABAergic inhibition facilitates polysynaptic A fiber-mediated excitatory transmission to the superficial spinal dorsal horn. Mol Cell Neurosci. 2003;24:818–830. - PubMed
    1. Bentley GN, Gent JP. Electrophysiological properties of substantia gelatinosa neurones in a novel adult spinal slice preparation. J Neurosci Methods. 1994;53:157–162. - PubMed
    1. Braz JM, Nassar MA, Wood JN, Basbaum AI. Parallel “pain” pathways arise from subpopulations of primary afferent nociceptor. Neuron. 2005;47:787–793. - PubMed
    1. Brown AG, Rose PK, Snow PJ. Morphology of hair follicle afferent fibre collaterals in the cat spinal cord. J Physiol. 1977;272:770–797. - PMC - PubMed

Publication types