Comparative Study
. 2009 Apr 22;29(16):5218-33.
doi: 10.1523/JNEUROSCI.0426-09.2009.

Phase-resetting curves determine synchronization, phase locking, and clustering in networks of neural oscillators

Affiliations
Comparative Study

Phase-resetting curves determine synchronization, phase locking, and clustering in networks of neural oscillators

Srisairam Achuthan et al. J Neurosci. .

Abstract

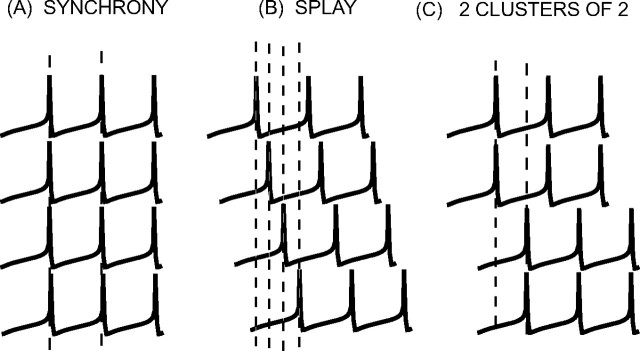
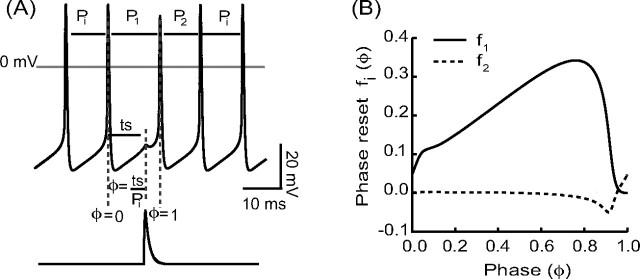
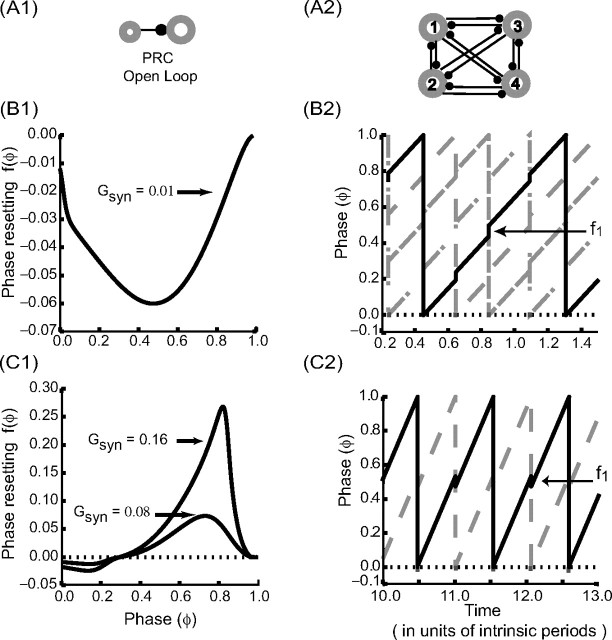
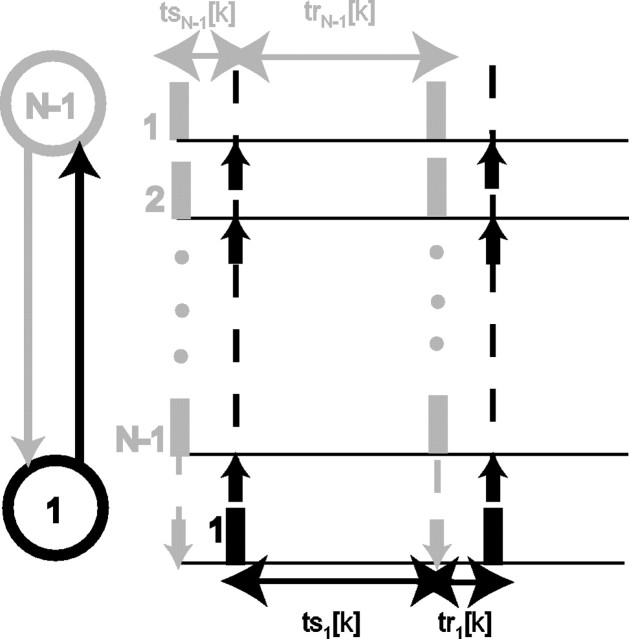
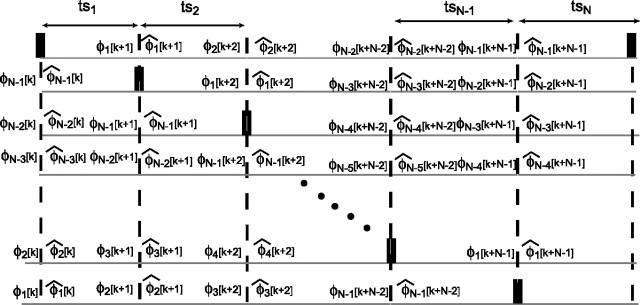
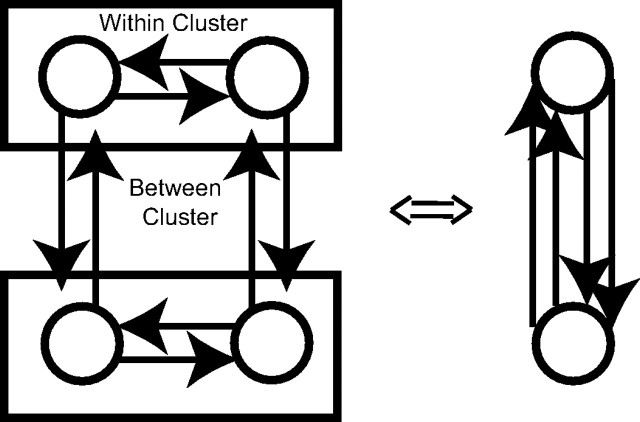
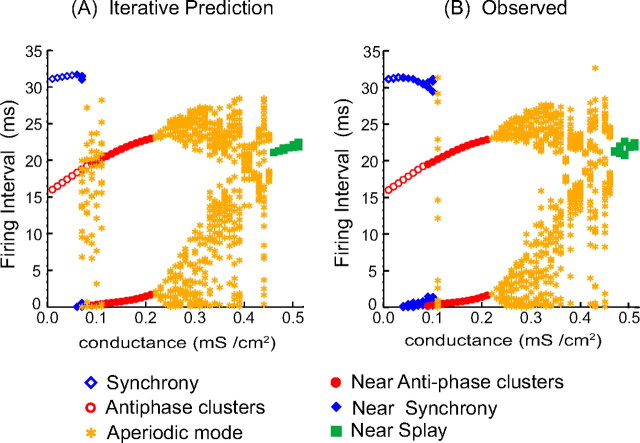
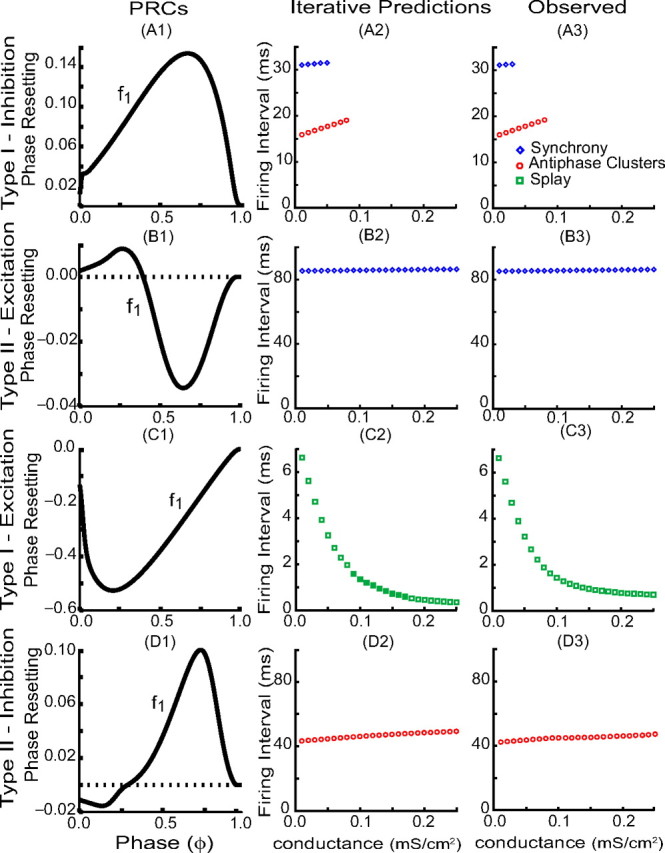
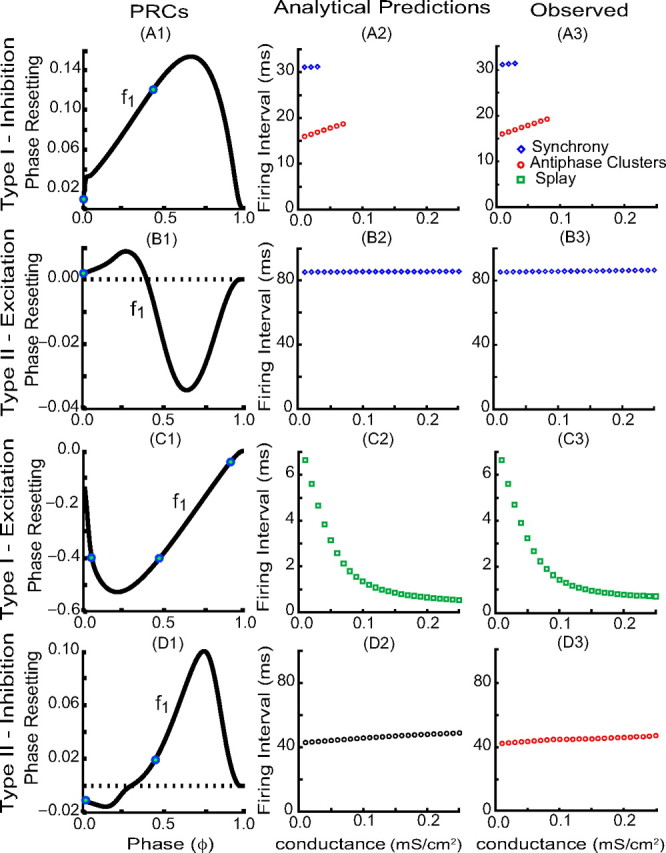
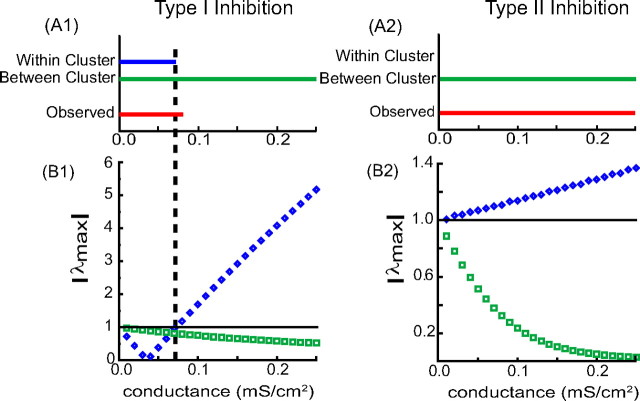
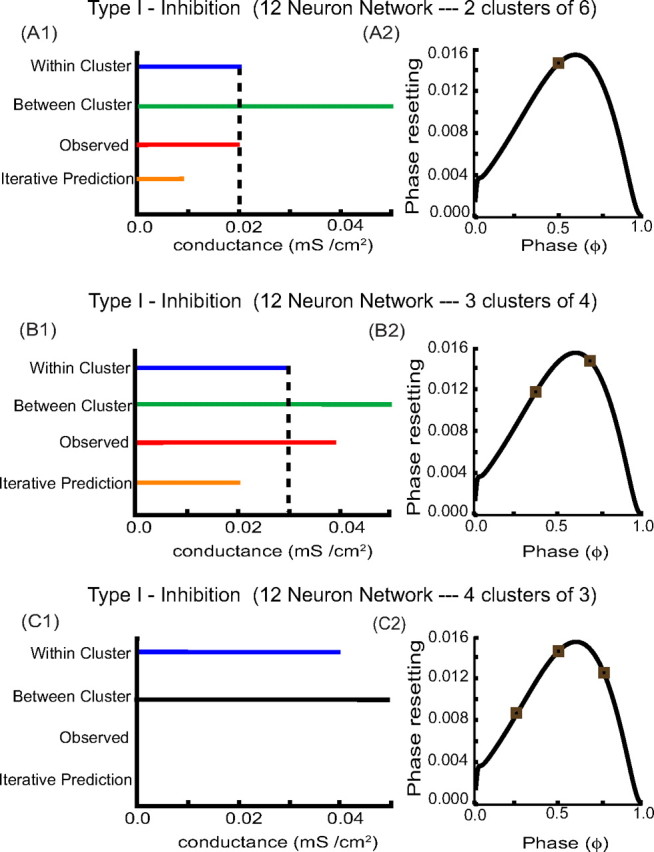
Networks of model neurons were constructed and their activity was predicted using an iterated map based solely on the phase-resetting curves (PRCs). The predictions were quite accurate provided that the resetting to simultaneous inputs was calculated using the sum of the simultaneously active conductances, obviating the need for weak coupling assumptions. Fully synchronous activity was observed only when the slope of the PRC at a phase of zero, corresponding to spike initiation, was positive. A novel stability criterion was developed and tested for all-to-all networks of identical, identically connected neurons. When the PRC generated using N-1 simultaneously active inputs becomes too steep, the fully synchronous mode loses stability in a network of N model neurons. Therefore, the stability of synchrony can be lost by increasing the slope of this PRC either by increasing the network size or the strength of the individual synapses. Existence and stability criteria were also developed and tested for the splay mode in which neurons fire sequentially. Finally, N/M synchronous subclusters of M neurons were predicted using the intersection of parameters that supported both between-cluster splay and within-cluster synchrony. Surprisingly, the splay mode between clusters could enforce synchrony on subclusters that were incapable of synchronizing themselves. These results can be used to gain insights into the activity of networks of biological neurons whose PRCs can be measured.


Figures

Figure 1.
Figure 1.
Firing modes in an all-to-all four-neuron network. Only the most commonly observed, rotationally symmetric modes are shown. A, Fully synchronous mode (one cluster of four neurons). B, Splay mode in which all neurons fire in a sequential manner. C, Two clusters of two neurons in antiphase with each other. The vertical dashed lines indicate the intervals between firing times.
Figure 2.
Figure 2.
Generation of the phase-resetting curve. A, The voltage waveform represents a regular spiking WB model neuron with intrinsic period Pi. The lower trace corresponds to the postsynaptic conductance resulting from a spike in the presynaptic model neuron. The change in the period Pi as a result of the perturbation received from the stimulus presynaptic action potential at a phase φ = ts/Pi is used to generate the phase-resetting curve. P1 represents the period of the cycle in which the stimulus is received. The following cycle period is represented by P2. B, Example of first-order (f1(φ)) and second-order (f2(φ)) phase-resetting curves. The parameter values for the WB model neuron considered are as follows: gsyn = 0.35 mS/cm2, τsyn = 1 ms, Iapp = 2.0 μA/cm2, and otherwise as in Materials and Methods.
Figure 3.
Figure 3.
Applying PRCs to iterative prediction of network activity. A1, PRCs for individual oscillators were generated using the open loop topology. A2, Schematic of a four-neuron network of all-to-all identical and identically coupled pulse-coupled oscillators. B1, PRC corresponding to gsyn = 0.01 mS/cm2 for a type I neuron with excitatory input. B2, Iterative map output for the splay mode. C1, PRC corresponding to gsyn = 0.08 and 0.16 mS/cm2 for a type II neuron with inhibitory input. C2, Iterative map output for the antiphase cluster mode. PRCs are nonlinear with respect to conductance strength. Note that in a network of four oscillators, each oscillator can receive up to three simultaneous inputs. For strong coupling, the resetting does not add linearly as evidenced by the changing shape as the conductance strength is increased to represent a single input [gsyn = 0.01 (in B1) and 0.08 (in C1) mS/cm2], two simultaneous inputs (gsyn = 0.16 mS/cm2), and three simultaneous inputs (data not shown). The phases increment linearly in time except when an input causes an instantaneous reset. In each case both first- and second-order resets (indicated by small negative excursions in B2 and C2) are incorporated.
Figure 4.
Figure 4.
Presumed firing pattern for stability proof. A perturbation of a single neuron away from the synchronous firing is assumed, and an iterated map based on the perturbation from synchrony on one cycle (ts).
Figure 5.
Figure 5.
Mapping that results from assumed splay mode firing pattern: The dashed vertical lines indicate the firing times within an assumed sequential firing order in a network of N neurons. Successive firing intervals denoted here as tsi (stimulus intervals), for i = 1 to N. For i = 1…N − 1, φi[k] and φ̂i[k] indicate the phase of the nonfiring oscillator in the kth cycle before and after firing.
Figure 6.
Figure 6.
Cluster mode prediction: within- and between-cluster interactions. Left, Schematic of four-neuron network with two clusters of two neurons each. Synchrony is observed within each cluster, and antiphase, which is an example of a splay mode, is observed between clusters. Within-cluster interactions are characterized by determining the stability of synchrony in an isolated two-neuron network (rectangle) with gsyn set to the value for a single synapse. Right, Between-cluster interactions are determined by collapsing the neurons within each rectangle to a single oscillator, and determining the existence and stability of a splay mode between two such oscillators using twice the conductance for a single synapse. This method generalizes to more clusters and to larger clusters.
Figure 7.
Figure 7.
Iteratively predicted versus observed firing intervals showing all observed modes. These results are for a four-neuron network with type I excitability and inhibitory synaptic connectivity. A, The firing intervals produced by the iterative map. B, Firing intervals produced by integrating the full system of differential equations. The modes labeled antiphase clusters or near antiphase clusters refer to two clusters in antiphase or near antiphase, whereas the synchronous and nearly synchronous modes refer to a single cluster.
Figure 8.
Figure 8.
Iterative map prediction versus the observed network behavior in four-neuron all-to-all networks. Typical PRCs are shown in the leftmost column corresponding to a synaptic conductance strength of 0.10 mS/cm2. Iterative map predictions are shown in the center column. The observed network dynamics resulting from integrating the full systems of differential equations are shown on the rightmost column. The open colored marker symbols indicate the firing intervals between spikes specific to a mode. A, WB model neurons (type I excitability) with inhibitory coupling. B, ML model neurons (type II excitability) with excitatory coupling. C, WB model neurons (type I excitability) with excitatory coupling. For gsyn from 0.09–0.17 mS/cm2, all second-order resetting except that due to the most recent input was ignored (filled green squares indicate the different implementation of the iterated map). This modification was required (in this regime only) for correct predictions. D, ML model neurons (type II excitability) with inhibitory coupling.
Figure 9.
Figure 9.
Analytical prediction versus the observed network behavior in four-neuron networks. Typical PRCs are shown in the leftmost column corresponding to a synaptic conductance strength of 0.10 mS/cm2. Analytical predictions are shown in the center column. The observed modes are shown once again on the rightmost column. The filled circles on the PRCs indicate the phase at which inputs are received by each neuron of the network. The firing intervals between spikes specific to each mode are indicated just as in Figure 8. The black open circles in D2 are used to indicate that the cluster mode is not in agreement with the observed mode (D3) with regard to stability. This is analyzed further in Figure 10.
Figure 10.
Figure 10.
A1, A2, Qualitative cluster mode prediction. When the cluster mode is observed, predictions are made analytically using within- and between-cluster interactions. The vertical dotted line indicates the intersection region where the within- and between-cluster interactions agree with the observed cluster mode (red line). For the four-neuron network, the blue line indicates stable synchronous mode in a two-neuron network corresponding to the within-cluster interactions. The green line indicates the stability of splay mode (two clusters of two neurons) corresponding to the between-cluster interactions. B1, B2, The absolute value of the largest eigenvalue (|λmax|) for the synchronous mode in a two-neuron network (blue diamonds) and for the two clusters of two-neuron mode (green squares) are plotted against the synaptic conductance strength). A value less than 1.0 indicates stable mode and a value greater than 1.0 indicates unstable mode.
Figure 11.
Figure 11.
Cluster predictions for three networks of 12 type I neurons with inhibitory inputs. The model neurons were type I WB neuron coupled by inhibition. PRCs are shown for gsyn = 0.01 mS/cm2. The brown squares on each PRC indicate the phases at which each cluster receives inputs from the other clusters (one, two, and three, respectively) in the network. The observed results are indicated by red horizontal lines and the results predicted by the iterative method are indicated by orange horizontal lines. A, Two clusters of six neurons. A1, Two clusters of size six were observed to be stable up to gsyn = 0.02 mS/cm2. Within-cluster synchrony is stable until gsyn = 0.02 mS/cm2. The splay mode captures the between-cluster interaction and remains stable beyond gsyn = 0.10 mS/cm2. The dashed vertical line indicates that the two clusters of six neurons are predicted to be stable until gsyn = 0.02 mS/cm2 by the analytical approach. A2, PRC. B, Three clusters of four neurons. B1, Three clusters of size four were observed to be stable up to gsyn = 0.04 mS/cm2. Within-cluster synchronous mode is stable until gsyn = 0.03 mS/cm2. The splay mode captures the between-cluster interaction and is stable for a range of conductance values. The vertical line indicated that the three clusters of four neurons are predicted to be stable until gsyn = 0.03 mS/cm2 by the analytical approach. B2, PRC. C, Four clusters of size three. C1, Four clusters of size three were not observed. Within-cluster synchronous mode is stable until gsyn = 0.04 mS/cm2. The between-cluster splay mode exists but is not stable (indicated by black bar) for the given range of conductance values. Four clusters of three neurons are predicted to be unstable by the analytical approach. C2, PRC.

Similar articles

Cited by

References

    1. Acker CD, Kopell N, White JA. Synchronization of strongly coupled excitatory neurons: relating network behavior to biophysics. J Comput Neurosci. 2003;15:71–90. - PubMed
    1. Bartos M, Vida I, Frotscher M, Geiger JRP, Jonas P. Rapid signaling at inhibitory synapses in a dentate gyrus interneuron network. J Neurosci. 2001;21:2687–2698. - PMC - PubMed
    1. Belykh I, de Lange E, Hasler M. Synchronization of bursting neurons: what matters in the network topology. Phys Rev Lett. 2005;94:188101. - PubMed
    1. Buzsáki G. Rhythms of the brain. New York: Oxford UP; 2006.
    1. Canavier CC, Butera RJ, Dror RO, Baxter DA, Clark JW, Byrne JH. Phase response characteristics of model neurons determine which patterns are expressed in a ring circuit model of gait generation. Biol Cybern. 1997;77:367–380. - PubMed

Publication types