Comparative Study
. 2009 Apr 22;29(16):5276-86.
doi: 10.1523/JNEUROSCI.6031-08.2009.

Gap junctions between striatal fast-spiking interneurons regulate spiking activity and synchronization as a function of cortical activity

Affiliations
Comparative Study

Gap junctions between striatal fast-spiking interneurons regulate spiking activity and synchronization as a function of cortical activity

Johannes Hjorth et al. J Neurosci. .

Abstract

Striatal fast-spiking (FS) interneurons are interconnected by gap junctions into sparsely connected networks. As demonstrated for cortical FS interneurons, these gap junctions in the striatum may cause synchronized spiking, which would increase the influence that FS neurons have on spiking by the striatal medium spiny (MS) neurons. Dysfunction of the basal ganglia is characterized by changes in synchrony or periodicity, thus gap junctions between FS interneurons may modulate synchrony and thereby influence behavior such as reward learning and motor control. To explore the roles of gap junctions on activity and spike synchronization in a striatal FS population, we built a network model of FS interneurons. Each FS connects to 30-40% of its neighbors, as found experimentally, and each FS interneuron in the network is activated by simulated corticostriatal synaptic inputs. Our simulations show that the proportion of synchronous spikes in FS networks with gap junctions increases with increased conductance of the electrical synapse; however, the synchronization effects are moderate for experimentally estimated conductances. Instead, the main tendency is that the presence of gap junctions reduces the total number of spikes generated in response to synaptic inputs in the network. The reduction in spike firing is due to shunting through the gap junctions; which is minimized or absent when the neurons receive coincident inputs. Together these findings suggest that a population of electrically coupled FS interneurons may function collectively as input detectors that are especially sensitive to synchronized synaptic inputs received from the cortex.


Figures

Figure 1.
Figure 1.
Model of striatal FS interneuron network with 10 neurons. A, I–F curves for the FS interneurons in the network. To avoid homogeneous populations, compartment length and KA conductance have been varied. The I–F curve of the original model (Kotaleski et al., 2006) is marked in black. B, Illustration of gap junction connections between two detailed FS neurons (not to scale). C, Coupling coefficient as a function of the gap junction conductance for steady state current injection versus spikes. The spike is triggered by a very brief current pulse. Gap junctions behave as a low pass filter and thus the coupling coefficient is lower for spikes. In both cases, resting potential was −63 mV for both neurons, and single cell input resistance was 477 MΩ. Both current injection and recording was somatic; spikes were generated by 1 ms, 0.2 nA injection. D, Example of networks of randomly electrically coupled FS interneurons. Only the soma of each neuron is shown, but the electrical connections are on primary dendrites. Each neuron has gap junctions to three neighbors, which gives a coupling probability of one-third between nearby neurons.
Figure 2.
Figure 2.
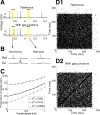
Role of gap junctions for synchronization in networks of two FS interneurons. A, Example voltage traces for two neurons without (Reference) or with proximal gap junctions (conductance 0.5 nS). The same synaptic input is repeated in both simulations. Note the change in spike number and spike timing. B, Zoomed in version of the traces in A. In the left subgraph a spike appears later in the trace with gap junctions and in addition triggers a spike in the neighboring cell. The right subgraph shows the disappearance of a spike instead. C, Proportion of synchronized spikes as a function of the conductance of the gap junctions. A spike is considered synchronous with another spike in an electrically coupled neuron if it appears within time Δt. D, JPSTH for two reference FS interneurons (D1) and for the FS interneurons coupled with a gap junction conductance 0.5 nS (D2). The diagonal represents synchronized spiking.
Figure 3.
Figure 3.
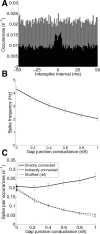
Influence of gap junctions on network spiking activity in a 10 FS network. A, Cross correlogram shows increase in synchrony due to gap junctions for the FS network. The black bars show results for the electrically coupled network (proximal gap junctions, 0.5 nS), with a relatively higher rate of synchronous spikes at ±5 ms; the gray bars show the uncoupled reference case, which has a higher rate of spike pairs at all interspike time intervals (bin size 1 ms) (compare with supplemental Fig. S1D, available at www.jneurosci.org as supplemental material). B, Spike frequency as a function of gap junction conductance, showing the decrease in firing as the conductance increases for neurons receiving synaptic input. The reduction is due to loss of charge (shunting) through the gap junctions. C, The occurrences of spike pairs in directly coupled (solid line) or indirectly coupled (dashed line) neurons spiking within Δt equals 5 ms of each other. Increased absolute numbers of synchronized spikes are limited to the directly electrically coupled neurons. The curve for the nondirectly coupled neurons follows what would be expected by chance, as illustrated by the close resemblance with the shuffled version of the coupled neuron case (where direct interactions mediated by gap junctions have been destroyed, but changes in correlation due to a change in firing frequency remain).
Figure 4.
Figure 4.
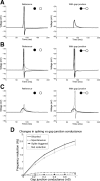
Mechanisms of spike appearance and disappearance in the electrically coupled networks. A, Removal of a spike. In the electrically coupled case the neuron receiving synaptic input loses charge to its nondepolarized neighbor, resulting in a subthreshold response in both neurons. B, Spike-induced triggering of a synchronized spike. The addition of gap junctions can sometimes lead to a sharing of the depolarization with the neighboring neuron, converting its subthreshold depolarization into a spike. C, Addition of a spike due to preceding depolarization of coupled neighboring neurons. First one neuron is depolarized by synaptic input, but not enough to cause a spike. In the presence of gap junctions some of this depolarization is transferred to the neighboring neuron, which brings it closer to threshold, sometimes allowing it to spike when it simultaneously receives additional synaptic input. D, Change in spikes caused by the addition of gap junctions. Solid trace shows the spikes shunted away (case A), dashed line those appearing spontaneously (case C), dash-dotted lines the spikes that are triggered by a spike in a neighboring neuron (case B), and gray dotted trace shows the net reduction in spikes. Note that the addition of spikes (cases B and C) is less common than the removal of spikes, producing a reduction in overall spiking activity with gap junctions.
Figure 5.
Figure 5.
Spike frequency reduction depends on input coherence between connected neurons. A, I–F curve for one FS interneuron connected to an identical neighboring FS interneuron with a gap junction. The neighboring neuron receives identical current injection (solid line), half amplitude (dashed line), no current (gray), or hyperpolarizing current (gray dashed). The firing frequency decreases as the difference in current between the two neurons increases. B, Reduction in firing frequency in the 10 FS neurons synaptically activated depends on the correlation of the voltage deflections in neighboring neurons. An increase in correlation between the synaptic input to the FS interneurons leads to a smaller reduction in firing frequency (see also supplemental Fig. S3A, available at www.jneurosci.org as supplemental material). C, Current through the gap junctions during a spike. Increased correlation between the synaptic input to the interneurons produces a smaller difference in the potential across the gap junction. This leads in particular to smaller outward currents through the gap junctions before a spike (arrow), as seen in the spike centered plot of the current. D, Ten identical FS interneurons driven by constant current injections in the range of 55 pA to 65 pA. Proximal gap junctions (0.5 nS) are added at 250 ms and removed again at 500 ms. The population synchronizes easily in the presence of gap junctions, and desynchronizes when they are removed. Note that the same result is achieved with varied FS excitability and identical current injections to all neurons (data not shown).
Figure 6.
Figure 6.
Spike frequency reduction decreases as synaptic activation increases in the network with gap junctions. A, At successively higher synaptic activation frequency, a smaller fraction of the spikes is removed in the presence of gap junctions in the 10 FS interneuron network. The fraction removed is the reduction in firing frequency in the network with gap junctions, divided by the firing frequency in the network devoid of gap junctions. B, As the activation frequency per synapse increases (resulting in more spikes in the network), so does the average voltage difference across the gap junction (inset) and the distribution widens, giving rise to larger average currents across the gap junction. C, Despite the average increase in the current through the gap junction during the whole simulation, just before a spike the current through the gap junctions is slightly smaller for high input frequencies. This is because with increased synaptic activation frequency it is more likely that the electrically coupled neighbor is depolarized at the same time. This, together with the flattening shape of the I–F curve (see Fig. 5A), explains the decreased reduction in spike frequencies for higher synaptic input frequencies. D, Change in spike frequency caused by addition of gap junctions as a function of synaptic input activation frequency. Solid trace shows the shunted spikes (see also Fig. 4A), dashed line shows those appearing spontaneously (see also Fig. 4C), and dash-dotted line represents the spikes that are triggered by a neighboring neuron spike (see also Fig. 4B). The gray dotted trace shows that the net reduction in spikes levels off with higher input intensities. E, Increased synaptic activation leads to higher relative spike synchronization. At the higher input, a spike in one neuron more easily triggers a synchronized spike in a neighboring neuron. Also the rate by which spikes are shunted away levels off. The synchrony in the network with gap junctions is higher than the shuffled control traces (where direct interactions mediated by gap junctions are removed). Spikes are considered synchronous if they occurred within 5 ms of each other. Note that even though the reference network devoid of gap junctions spikes more and thus by chance has higher occurrences of spike pairs, spike synchronization is even higher in the subpopulation of directly coupled neighbors despite a lower average firing frequency.
Figure 7.
Figure 7.
Coincidence detection in FS networks. A, An FS network with gap junctions can act as a population detector of coincident synaptic inputs. A sudden increase in correlation between the synaptic activation times in the FS interneurons (during 20 ms) is detected by increased spiking in cells of the 10 FS interneuron network. For the unconnected reference case, there is no change in the firing frequency during the time of increased network input correlation between the neurons, because the average frequency of synaptic activation is kept constant. B, Illustration of a 125 FS neuron network with proximal gap junctions. The center neurons receiving 20 ms of correlated input are marked. C, Coincidence detection in the larger 125 FS network. Here, a group of 27 neurons share correlated input for 20 ms, the remaining 98 neurons have no change in the correlation between themselves. The 27 neurons show an increase in firing during the 20 ms if they are gap junction coupled, as was also seen in A. D, A cross-correlogram showing weak local but no global synchronization. Directly coupled neurons show weak synchronization; however, as the subset is increased to include neighboring neurons not directly coupled, the synchronization disappears, indicating that there is no global synchronization.

Similar articles

Cited by

References

    1. Aertsen AMHJ, Gerstein GL, Habib MK, Palm G. Dynamics of neuronal firing correlation: modulation of “effective connectivity.”. J Neurophysiol. 1989;61:900–917. - PubMed
    1. Amitai Y, Gibson JR, Beierlein M, Patrick SL, Ho AM, Connors BW, Golomb D. The spatial dimensions of electrically coupled networks of interneurons in the neocortex. J Neurosci. 2002;22:4142–4152. - PMC - PubMed
    1. Bar-Gad I, Morris G, Bergman H. Information processing, dimensionality reduction and reinforcement learning in the basal ganglia. Prog Neurobiol. 2003;71:439–473. - PubMed
    1. Bennett BD, Bolam JP. Synaptic input and output of parvalbumin-immunoreactive neurons in the neostriatum of the rat. Neuroscience. 1994;62:707–719. - PubMed
    1. Berke JD. Uncoordinated firing rate changes of striatal fast-spiking interneurons during behavioral task performance. J Neurosci. 2008;28:10075–10080. - PMC - PubMed

Publication types

MeSH terms

LinkOut - more resources