

Long-term plasticity in mouse sensorimotor circuits after rhythmic whisker stimulation
- PMID: 19386929
- PMCID: PMC6665482
- DOI: 10.1523/JNEUROSCI.5965-08.2009
Long-term plasticity in mouse sensorimotor circuits after rhythmic whisker stimulation
Abstract
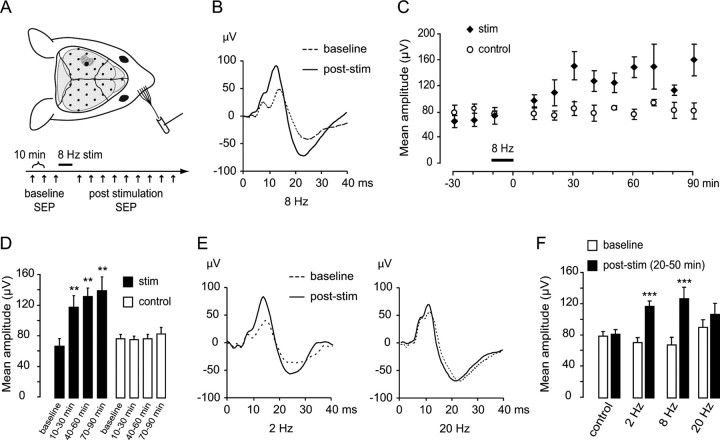
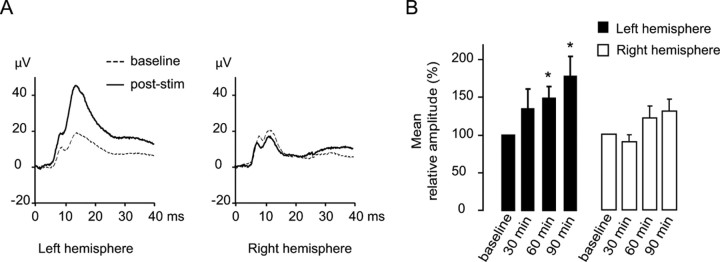
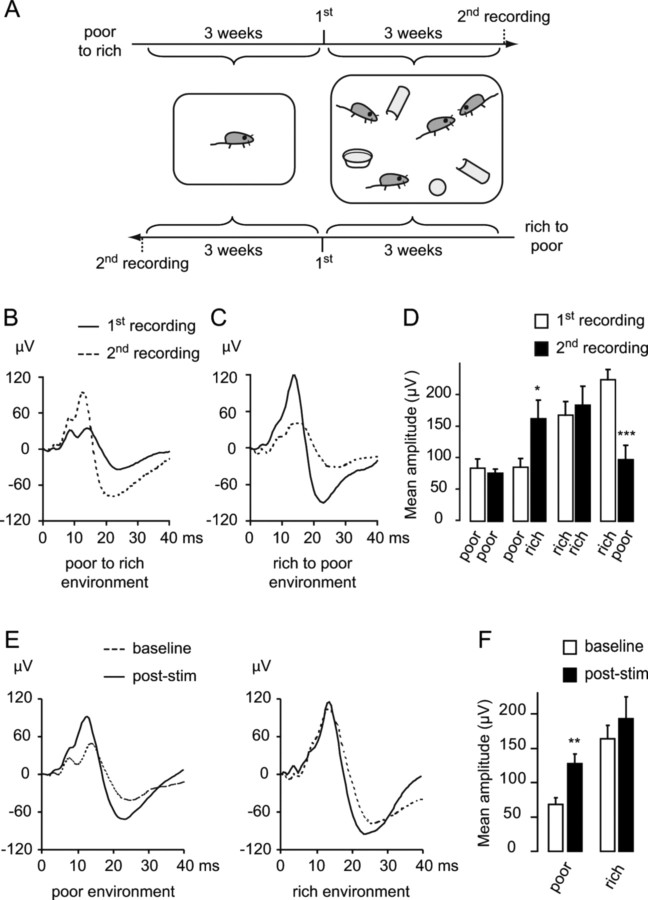
Mice actively explore their environment by rhythmically sweeping their whiskers. As a consequence, neuronal activity in somatosensory pathways is modulated by the frequency of whisker movement. The potential role of rhythmic neuronal activity for the integration and consolidation of sensory signals, however, remains unexplored. Here, we show that a brief period of rhythmic whisker stimulation in anesthetized mice resulted in a frequency-specific long-lasting increase in the amplitude of somatosensory-evoked potentials in the contralateral primary somatosensory (barrel) cortex. Mapping of evoked potentials and intracortical recordings revealed that, in addition to potentiation in layers IV and II/III of the barrel cortex, rhythmic whisker stimulation induced a decrease of somatosensory-evoked responses in the supragranular layers of the motor cortex. To assess whether rhythmic sensory input-based plasticity might arise in natural settings, we exposed mice to environmental enrichment. We found that it resulted in somatosensory-evoked responses of increased amplitude, highlighting the influence of previous sensory experience in shaping sensory responses. Importantly, environmental enrichment-induced plasticity occluded further potentiation by rhythmic stimulation, indicating that both phenomena share common mechanisms. Overall, our results suggest that natural, rhythmic patterns of whisker activity can modify the cerebral processing of sensory information, providing a possible mechanism for learning during sensory perception.
Figures


Similar articles
-
Long-Term Synaptic Plasticity in Rat Barrel Cortex.Cereb Cortex. 2015 Sep;25(9):2741-51. doi: 10.1093/cercor/bhu071. Epub 2014 Apr 15. Cereb Cortex. 2015. PMID: 24735674
-
Contribution of supragranular layers to sensory processing and plasticity in adult rat barrel cortex.J Neurophysiol. 1998 Dec;80(6):3261-71. doi: 10.1152/jn.1998.80.6.3261. J Neurophysiol. 1998. PMID: 9862920
-
Repetitive Sensory Stimulation Potentiates and Recruits Sensory-Evoked Cortical Population Activity.J Neurosci. 2025 Jan 22;45(4):e2189232024. doi: 10.1523/JNEUROSCI.2189-23.2024. J Neurosci. 2025. PMID: 39510832 Free PMC article.
-
Sensorimotor processing in the rodent barrel cortex.Nat Rev Neurosci. 2019 Sep;20(9):533-546. doi: 10.1038/s41583-019-0200-y. Epub 2019 Jul 31. Nat Rev Neurosci. 2019. PMID: 31367018 Free PMC article. Review.
-
Cortical control of whisker movement.Annu Rev Neurosci. 2014;37:183-203. doi: 10.1146/annurev-neuro-062012-170344. Epub 2014 May 9. Annu Rev Neurosci. 2014. PMID: 24821429 Review.
Cited by
-
Tactile Defensiveness and Impaired Adaptation of Neuronal Activity in the Fmr1 Knock-Out Mouse Model of Autism.J Neurosci. 2017 Jul 5;37(27):6475-6487. doi: 10.1523/JNEUROSCI.0651-17.2017. Epub 2017 Jun 12. J Neurosci. 2017. PMID: 28607173 Free PMC article.
-
Environmental enrichment causes a global potentiation of neuronal responses across stimulus complexity and lamina of sensory cortex.Front Cell Neurosci. 2013 Aug 8;7:124. doi: 10.3389/fncel.2013.00124. eCollection 2013. Front Cell Neurosci. 2013. PMID: 23964199 Free PMC article.
-
Hindlimb Somatosensory Information Influences Trunk Sensory and Motor Cortices to Support Trunk Stabilization.Cereb Cortex. 2021 Oct 1;31(11):5165-5187. doi: 10.1093/cercor/bhab150. Cereb Cortex. 2021. PMID: 34165153 Free PMC article.
-
Translational approach to behavioral learning: lessons from cerebellar plasticity.Neural Plast. 2013;2013:853654. doi: 10.1155/2013/853654. Epub 2013 Nov 11. Neural Plast. 2013. PMID: 24319600 Free PMC article. Review.
-
Piriform cortical glutamatergic and GABAergic neurons express coordinated plasticity for whisker-induced odor recall.Oncotarget. 2017 Sep 23;8(56):95719-95740. doi: 10.18632/oncotarget.21207. eCollection 2017 Nov 10. Oncotarget. 2017. PMID: 29221161 Free PMC article.
References
-
- Agmon A, Connors BW. Thalamocortical responses of mouse somatosensory (barrel) cortex in vitro. Neuroscience. 1991;41:365–379. - PubMed
-
- Allison T, McCarthy G, Wood CC, Darcey TM, Spencer DD, Williamson PD. Human cortical potentials evoked by stimulation of the median nerve. I. Cytoarchitectonic areas generating short-latency activity. J Neurophysiol. 1989a;62:694–710. - PubMed
-
- Allison T, McCarthy G, Wood CC, Williamson PD, Spencer DD. Human cortical potentials evoked by stimulation of the median nerve. II. Cytoarchitectonic areas generating long-latency activity. J Neurophysiol. 1989b;62:711–722. - PubMed
-
- Armstrong-James M, Fox K, Das-Gupta A. Flow of excitation within rat barrel cortex on striking a single vibrissa. J Neurophysiol. 1992;68:1345–1358. - PubMed
-
- Brecht M, Schneider M, Sakmann B, Margrie TW. Whisker movements evoked by stimulation of single pyramidal cells in rat motor cortex. Nature. 2004;427:704–710. - PubMed
Publication types
MeSH terms
LinkOut - more resources
Full Text Sources
Research Materials