. 2009 Sep;23(9):1605-13.
doi: 10.1038/leu.2009.82. Epub 2009 Apr 23.

Accurate detection of uniparental disomy and microdeletions by SNP array analysis in myelodysplastic syndromes with normal cytogenetics

Affiliations

Accurate detection of uniparental disomy and microdeletions by SNP array analysis in myelodysplastic syndromes with normal cytogenetics

S Heinrichs et al. Leukemia. 2009 Sep.

Abstract

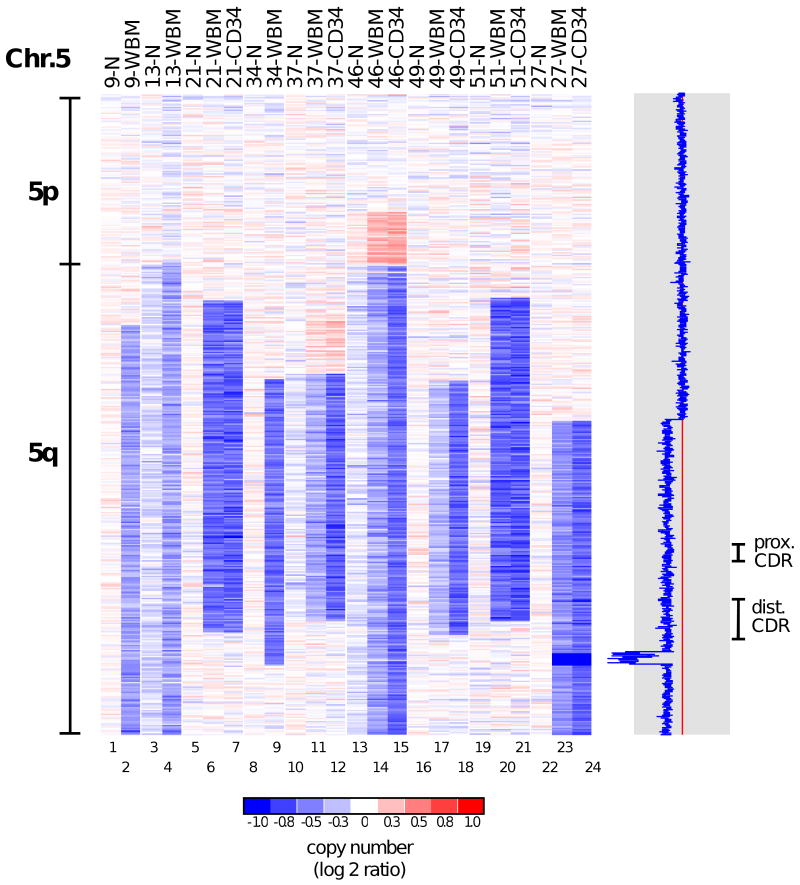
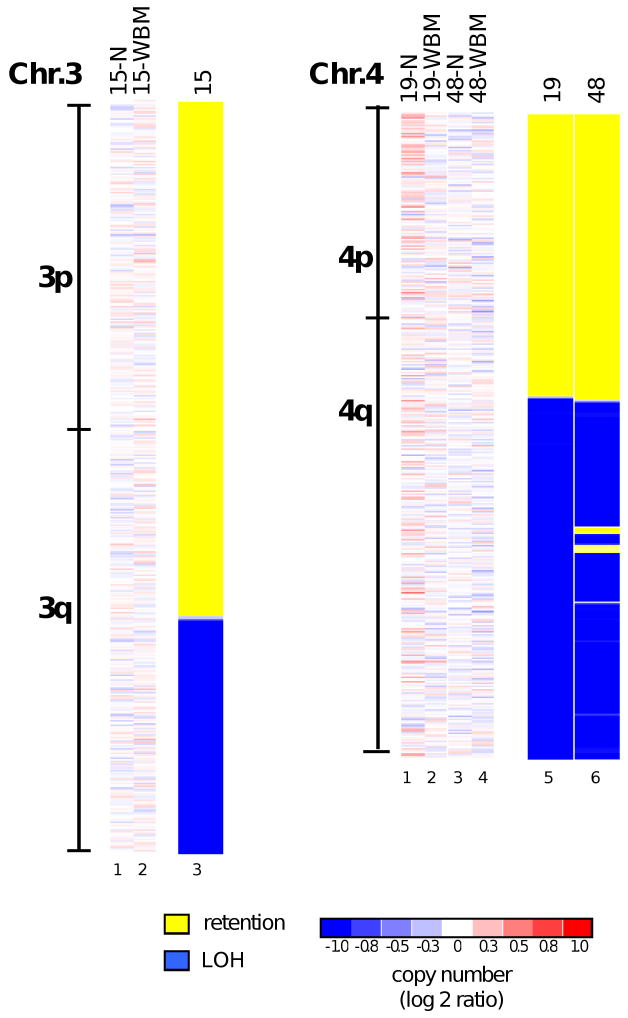
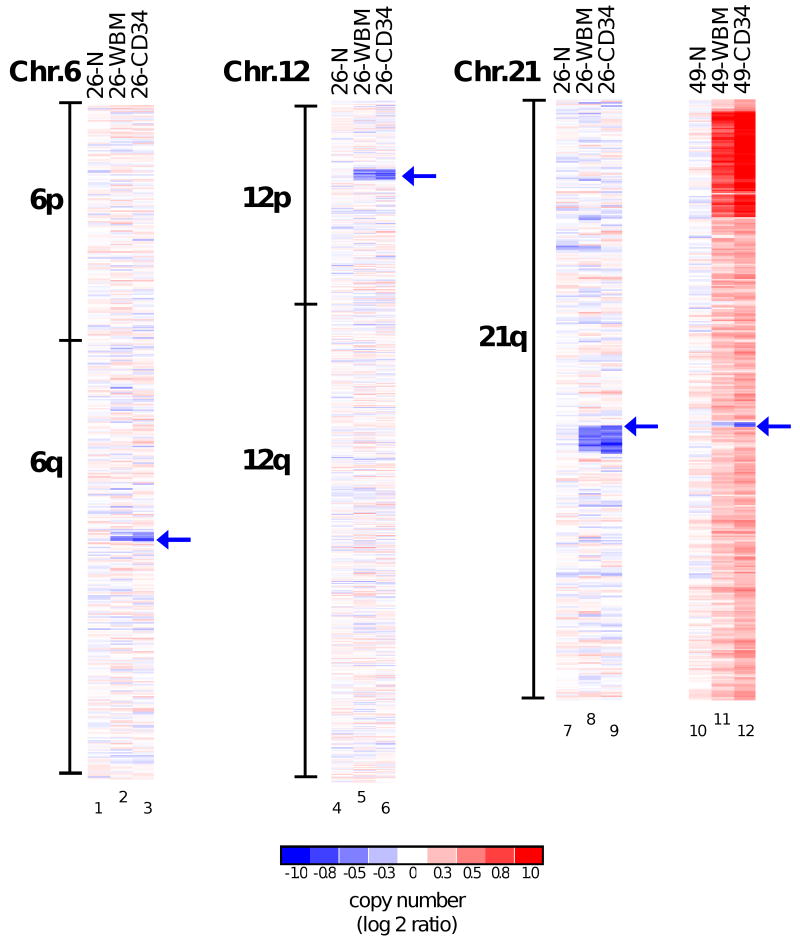
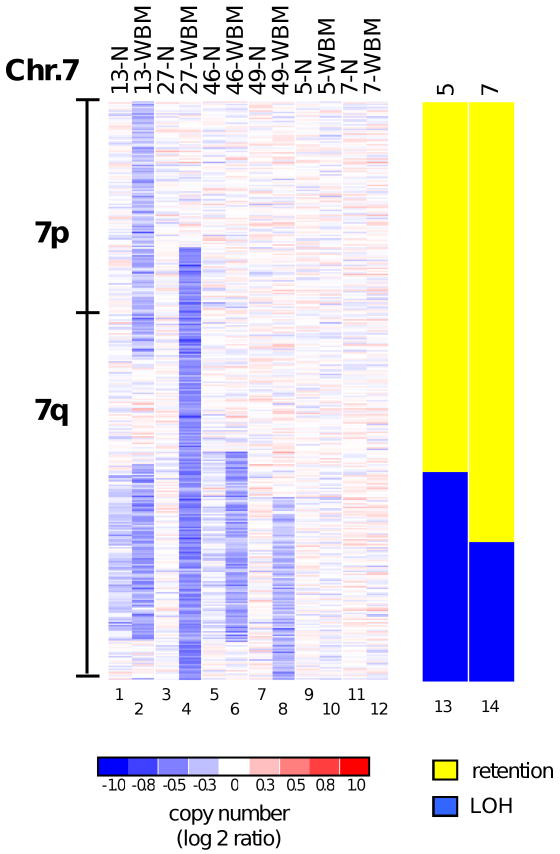
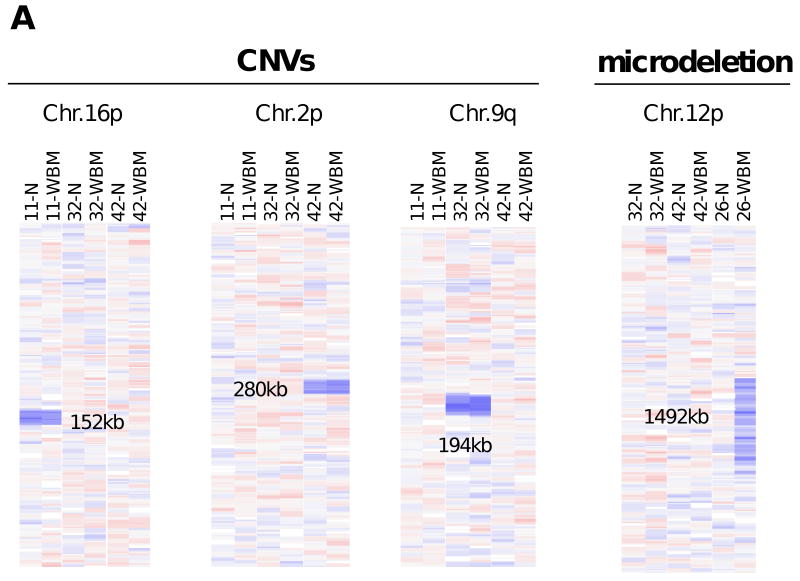
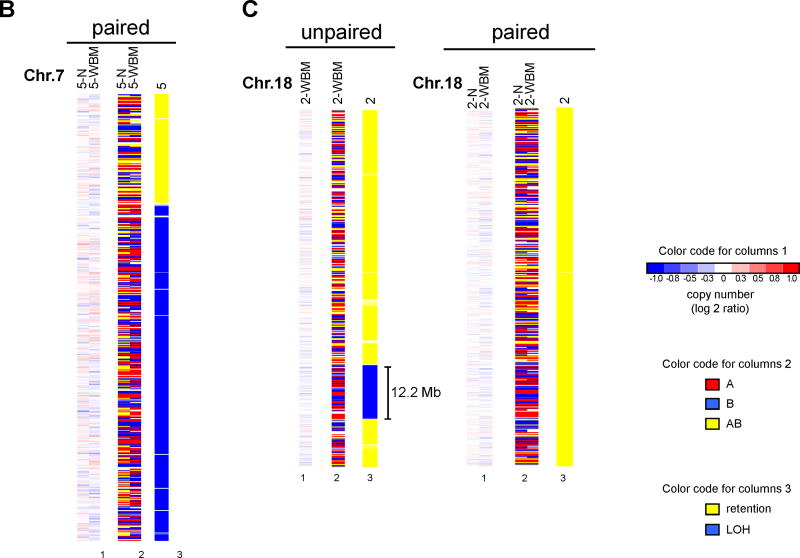
Progress in the management of patients with myelodysplastic syndromes (MDS) has been hampered by the inability to detect cytogenetic abnormalities in 40-60% of cases. We prospectively analyzed matched pairs of bone marrow and buccal cell (normal) DNA samples from 51 MDS patients by single nucleotide polymorphism (SNP) arrays, and identified somatically acquired clonal genomic abnormalities in 21 patients (41%). Among the 33 patients with normal bone marrow cell karyotypes, 5 (15%) had clonal, somatically acquired aberrations by SNP array analysis, including 4 with segmental uniparental disomies (UPD) and 1 with three separate microdeletions. Each abnormality was detected more readily in CD34+ cells than in unselected bone marrow cells. Paired analysis of bone marrow and buccal cell DNA from each patient was necessary to distinguish true clonal genomic abnormalities from inherited copy number variations and regions with apparent loss of heterozygosity. UPDs affecting chromosome 7q were identified in two patients who had a rapidly deteriorating clinical course despite a low-risk International Prognostic Scoring System score. Further studies of larger numbers of patients will be needed to determine whether 7q UPD detected by SNP array analysis will identify higher risk MDS patients at diagnosis, analogous to those with 7q cytogenetic abnormalities.


Figures

Figure 1
Figure 1. Copy number alterations on chromosome 5
The copy number values for probe sets on chromosome 5 are shown as log2 ratios. Patients with abnormalities affecting this chromosome are identified at the top of each column together with the DNA source (N, normal cells; WBM, whole bone marrow mononuclear cells; CD34, CD34+ bone marrow cells). White areas indicate no copy number change (log2 ratio = zero), while shades of blue and red designate losses and gains, respectively (see scale at bottom). All blue areas on the q-arm correspond to heterozygous deletions, except in patient 27, where a homozygously deleted area (dark blue) was found within the heterozygous region of loss. A profile view of the copy number for this patient is shown on the right. The red line indicates the expected normal copy number, while the blue line indicates the log2 ratio of the measured copy number along the chromosome. The positions of the two previously described common deleted regions (CDRs) of chromosome 5q are indicated.
Figure 2
Figure 2. Uniparental disomies in cases with a normal bone marrow cell karyotype
Copy number analysis and paired genotype (LOH) analysis are shown for patients 15, 19 and 48, as indicated at the top of each column together with the DNA source (N, normal cells; WBM, whole bone marrow mononuclear cells). Only informative chromosomes are shown; all remaining chromosomal regions were normal by copy number and LOH analysis. The finding of LOH with a normal copy number reveals the presence of segmental UPD in these patients.
Figure 3
Figure 3. Small deletions identified in patients 26 and 49
Copy number values along chromosomes 6 and 12 (patient 26) and 21 (patient 26 and 49) are shown as log2 ratios. Patient identifiers are designated at the top of each column, together with the DNA source (N, normal cells; WBM, whole bone marrow mononuclear cells). The blue arrows indicate the loci of deletions. On chromosome 21, the arrows indicate the locus of the RUNX1 gene, which is affected by a deletion distal to the centromere in patient 26 and proximal in patient 49. Chromosomes are not drawn to scale.
Figure 4
Figure 4. Uniparental disomies and copy number alterations on chromosome 7
Copy number values along chromosome 7 are shown as log2 ratios for all patients having a copy number change on this chromosome and for patients 6 and 8, who lack a copy number change. Patient identifiers are included at the top of each column together with the DNA source (N, normal cells; WBM, whole bone marrow mononuclear cells). Two additional plots (for patients 5 and 7) show the results of a paired genotype analysis (LOH analysis), which is based on the comparison of mononuclear cell DNA with matched DNA. Yellow areas indicate retention of the genotype, while blue areas indicate LOH. In patients 5 and 7, the finding of LOH extending to the telomere of the long arm of chromosome 7 with a normal copy number is caused by segmental UPD (see text).
Figure 5
Figure 5
A: Comparison of CNV loci and mircrodeletions. The copy number values are shown as log 2 ratios at high magnification. Different chromosomes are not drawn to the same scale. Patients are identified at the top of each column together with the DNA source (N, normal cells; WBM, whole bone marrow mononuclear cells). The comparative analysis of copy number values with a match normal allows the differentiation of CNVs (left panel) and microdeletions (right panel). CNVs and microdeletions shown here explamplify findings summarized in Supplementary Table 1 and 3. B/C: Detection of true UPDs in paired samples as opposed to findings by unpaired LOH analysis. The results of copy number analysis are shown in the columns labeled “1”and reveal no deletions or gains. The raw genotyping calls are depicted in columns labeled “2” (A in red, B in blue, AB in yellow). The inferred LOH analysis (column 3; yellow signifies retention and blue LOH, respectively) is the result of the comparative genotype analysis. In cases of unpaired analysis, 60 normal controls (not shown) were used (CEPH subset of the HapMap project). Planel B illustrates the detection of a true UPD on chromosome 7p in patient 5. Planel C: Detection of a 12Mb locus with apparent UPD by unpaired analysis in patient 2, that is reveal as strech of inherited homozygosity by paired analysis. The comparison between left and right part of panel C emphasizes the necessity of paired analysis.
Figure 5
Figure 5
A: Comparison of CNV loci and mircrodeletions. The copy number values are shown as log 2 ratios at high magnification. Different chromosomes are not drawn to the same scale. Patients are identified at the top of each column together with the DNA source (N, normal cells; WBM, whole bone marrow mononuclear cells). The comparative analysis of copy number values with a match normal allows the differentiation of CNVs (left panel) and microdeletions (right panel). CNVs and microdeletions shown here explamplify findings summarized in Supplementary Table 1 and 3. B/C: Detection of true UPDs in paired samples as opposed to findings by unpaired LOH analysis. The results of copy number analysis are shown in the columns labeled “1”and reveal no deletions or gains. The raw genotyping calls are depicted in columns labeled “2” (A in red, B in blue, AB in yellow). The inferred LOH analysis (column 3; yellow signifies retention and blue LOH, respectively) is the result of the comparative genotype analysis. In cases of unpaired analysis, 60 normal controls (not shown) were used (CEPH subset of the HapMap project). Planel B illustrates the detection of a true UPD on chromosome 7p in patient 5. Planel C: Detection of a 12Mb locus with apparent UPD by unpaired analysis in patient 2, that is reveal as strech of inherited homozygosity by paired analysis. The comparison between left and right part of panel C emphasizes the necessity of paired analysis.

References

    1. Corey SJ, Minden MD, Barber DL, Kantarjian H, Wang JC, Schimmer AD. Myelodysplastic syndromes: the complexity of stem-cell diseases. Nat Rev Cancer. 2007 Feb;7(2):118–129. - PubMed
    1. Estey E. Acute myeloid leukemia and myelodysplastic syndromes in older patients. J Clin Oncol. 2007 May 10;25(14):1908–1915. - PubMed
    1. Nimer SD. Myelodysplastic syndromes. Blood. 2008 May 15;111(10):4841–4851. - PubMed
    1. de Witte T, Oosterveld M, Muus P. Autologous and allogeneic stem cell transplantation for myelodysplastic syndrome. Blood Rev. 2007 Jan;21(1):49–59. - PubMed
    1. Haase D, Germing U, Schanz J, Pfeilstocker M, Nosslinger T, Hildebrandt B, et al. New insights into the prognostic impact of the karyotype in MDS and correlation with subtypes: evidence from a core dataset of 2124 patients. Blood. 2007 Dec 15;110(13):4385–4395. - PubMed

Publication types