. 2009 Jun 3;28(11):1637-43.
doi: 10.1038/emboj.2009.102. Epub 2009 Apr 23.

Inter-subunit interaction of gastric H+,K+-ATPase prevents reverse reaction of the transport cycle

Affiliations

Inter-subunit interaction of gastric H+,K+-ATPase prevents reverse reaction of the transport cycle

Kazuhiro Abe et al. EMBO J. .

Abstract

The gastric H(+),K(+)-ATPase is an ATP-driven proton pump responsible for generating a million-fold proton gradient across the gastric membrane. We present the structure of gastric H(+),K(+)-ATPase at 6.5 A resolution as determined by electron crystallography of two-dimensional crystals. The structure shows the catalytic alpha-subunit and the non-catalytic beta-subunit in a pseudo-E(2)P conformation. Different from Na(+),K(+)-ATPase, the N-terminal tail of the beta-subunit is in direct contact with the phosphorylation domain of the alpha-subunit. This interaction may hold the phosphorylation domain in place, thus stabilizing the enzyme conformation and preventing the reverse reaction of the transport cycle. Indeed, truncation of the beta-subunit N-terminus allowed the reverse reaction to occur. These results suggest that the beta-subunit N-terminus prevents the reverse reaction from E(2)P to E(1)P, which is likely to be relevant for the generation of a large H(+) gradient in vivo situation.


Figures

Figure 1
Figure 1
Cryo-EM structure of gastric H+,K+-ATPase at 6.5 Å resolution. (A) Reaction scheme of the ion transport cycle. The equilibrium between the E1P and E2P states of the gastric H+,K+-ATPase is largely shifted towards the E2P state during the phosphorylation reaction (E2P preference). In our 2D crystals grown in the presence of AlF4 and ADP, the H+,K+-ATPase adopts a pseudo-E2P state (shown in red). (B) Negatively stained 2D crystal of the H+,K+-ATPase (arrow) with small amounts of aggregation (arrowhead). (C) The density map of the H+,K+-ATPase 2D crystal contoured at 1.0 σ shows that the 2D crystals consist of two membrane layers (indicated as M). One αβ-protomer is shown as solid surface representation (dark blue). (D) Surface representation of the extracted density map (see Materials and methods) of an H+,K+-ATPase αβ-protomer with the fit homology model in ribbon representation. Colour code of the density map: N domain, green; A domain, cyan; P domain, yellow; TM domain of the α-subunit, wheat; β-subunit, magenta. Colour code of the homology model: N, A and P domains have the same colour as the density map; TM helices M1–M10 of the α-subunit, gradual change from M1 (blue) to M10 (red); TM helix of β-subunit, white. The dotted lines indicate the probable position of the lipid head group, resulting total thickness of approximately 35 Å, which is based on the densities protruding perpendicular from the TM domain (arrowheads). The bound ADP and AlF4 molecules are shown as red spheres.
Figure 2
Figure 2
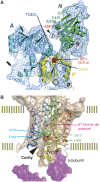
Architecture of the H+,K+-ATPase αβ-protomer in the pseudo-E2P state. (A) Relative orientation of the cytoplasmic domains. The cytoplasmic domains of the homology model (in ribbon representation and colour coded as in Figure 1D) are superimposed on the density map contoured at 1.0 σ (blue mesh). A spherical density contoured at the 5.5 σ level (red) near the phosphorylation site (Asp 385) shows the position of the AlF4 complex. The ADP molecule (stick representation) was fitted into the extra density found at the surface of the N domain (single arrowhead). The double arrowhead indicates the extra globular density found near the most N-terminal Lys 36 (blue sphere) in the homology model. Several key amino acids, including invariant 228TGES motif, are shown in sphere representation. (B) Surface representation of the segmented map of the TM region of the α- (wheat) and β-subunit (magenta) contoured at 1.0 σ. The TM helices of the homology model of the α-subunit (coloured as in Figure 1D) and the β-subunit (white) are shown as tube models. The red spheres indicate the positions that correspond to bound Rb+ in the Na+,K+-ATPase structure, showing the approximate locations of the cation-binding sites in the H+,K+-ATPase. The arrowhead indicates a funnel-like cavity that is surrounded by several amino acids important for inhibitor binding (shown as spheres). The conserved SYGQ sequence, which is critical for the assembly of the αβ-protomer, is shown as yellow spheres.
Figure 3
Figure 3
The N-terminal tail of the β-subunit functions as a ratchet. (A) Interaction between the α- and β-subunits. Segmented density map showing the P domain in yellow and the β-subunit in magenta. The single and double arrowheads indicate the position where the N-terminal tail of the β-subunit (βN) contacts the P domain and M3, respectively. The gray mesh represents the experimental density map including the symmetry-related molecule contoured at 1.0 σ. The triple arrowhead indicates the density that represents the N domain of the symmetry-related molecule. (B) ADP or K+ sensitivity of the EP formed by βN deletion mutants. Pulse-chase experiments were performed on membrane fractions of wild-type (WT) and N-terminal deletion mutants (Δ4–Δ13) of the β-subunit co-expressed with wild-type α-subunit. The membrane fractions were phosphorylated for 10 s at 0°C with [γ-32P]ATP. To measure dephosphorylation, the EP was chased with an excess of cold ATP to terminate phosphorylation from [γ-32P]ATP, without (ligand free, blue) or with 1 mM ADP (+ADP, red) or 10 mM K+ (+K+, green), followed by acid quenching after 5 s of chasing (see Materials and methods). For each mutant, the phosphorylation level of the ‘ligand-free' condition was assigned to 100%. Error bars show the standard deviation for three experiments. Asterisks indicate values significantly different from that of the wild-type one (P<0.01). (C) Comparison of the H+,K+-ATPase in the pseudo-E2P state (surface representation as shown in Figure 1D) with SERCA in the E1P-ADP state (ribbon model, PDB code 2ZBD). For clarity, the A domain and TM helices of SERCA are not shown. The two structures were aligned based on the M7–M10 segments. The ADP and AlF4 molecules are shown as blue and red spheres, respectively.

Comment in

  • One way for the gastric proton pump.
    Nissen P. Nissen P. EMBO J. 2009 Jun 3;28(11):1535-6. doi: 10.1038/emboj.2009.137. EMBO J. 2009. PMID: 19494845 Free PMC article. No abstract available.

References

    1. Abe K, Kaya S, Imagawa T, Taniguchi K (2002) Gastric H/K-ATPase liberates two moles of Pi from one mole of phosphoenzyme formed from a high-affinity ATP binding site and one mole of enzyme-bound ATP at the low-affinity site during cross-talk between catalytic subunits. Biochemistry 41: 2438–2445 - PubMed
    1. Agard DA (1983) A least-squares method for determining structure factors in three-dimensional tilted-view reconstructions. J Mol Biol 167: 849–852 - PubMed
    1. Asano S, Io T, Kimura T, Sakamoto S, Takeguchi N (2001) Alanine-scanning mutagenesis of the sixth transmembrane segment of gastric H+,K+-ATPase α-subunit. J Biol Chem 276: 31265–31273 - PubMed
    1. Asano S, Kimura T, Ueno S, Kawamura M, Takeguchi N (1999) Chimeric domain analysis of the compatibility between H+,K+-ATPase and Na+,K+-ATPase β-subunits for the functional expression of gastric H+,K+-ATPase. J Biol Chem 274: 22257–22265 - PubMed
    1. Asano S, Tega Y, Konishi K, Fujioka M, Takeguchi N (1996) Functional expression of gastric H+,K+-ATPase and site-directed mutagenesis of the putative cation binding site and the catalytic center. J Biol Chem 271: 2740–2745 - PubMed

Publication types

MeSH terms

Substances

LinkOut - more resources