Comparative Study
. 2009 May;29(5):997-1007.
doi: 10.1002/jmri.21731.

MRI and histological analysis of beta-amyloid plaques in both human Alzheimer's disease and APP/PS1 transgenic mice

Affiliations
Comparative Study

MRI and histological analysis of beta-amyloid plaques in both human Alzheimer's disease and APP/PS1 transgenic mice

Mark D Meadowcroft et al. J Magn Reson Imaging. 2009 May.

Abstract

Purpose: To investigate the relationship between MR image contrast associated with beta-amyloid (Abeta) plaques and their histology and compare the histopathological basis of image contrast and the relaxation mechanism associated with Abeta plaques in human Alzheimer's disease (AD) and transgenic APP/PS1 mouse tissues.

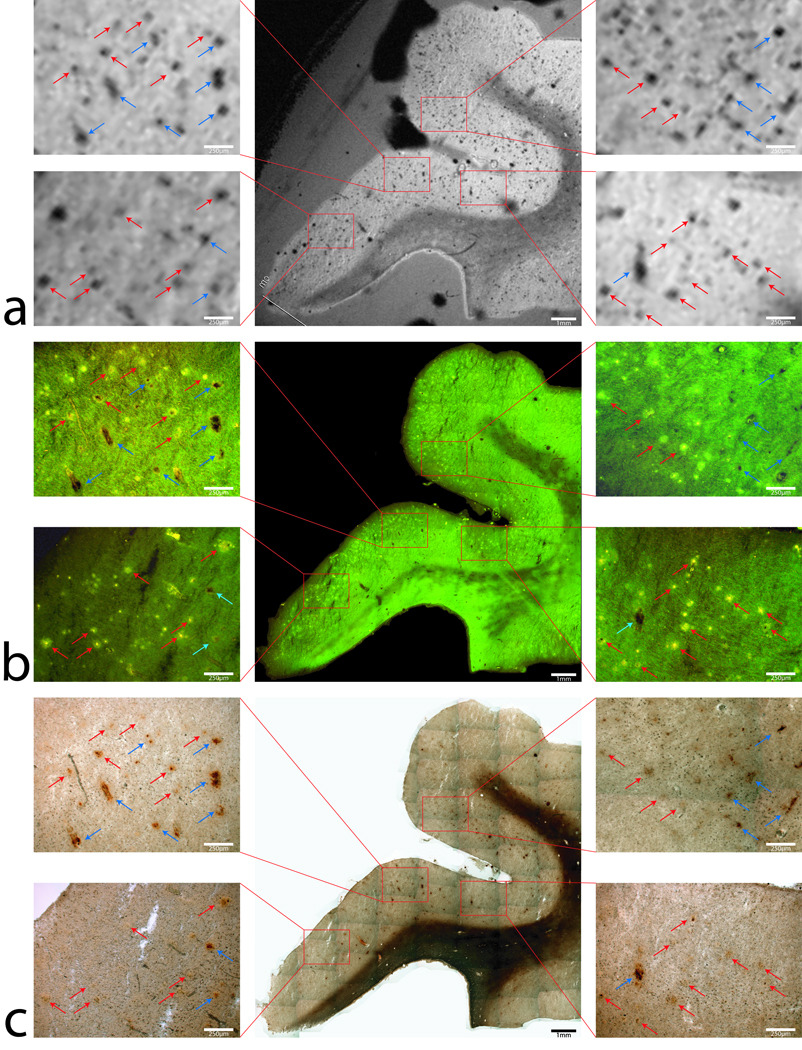
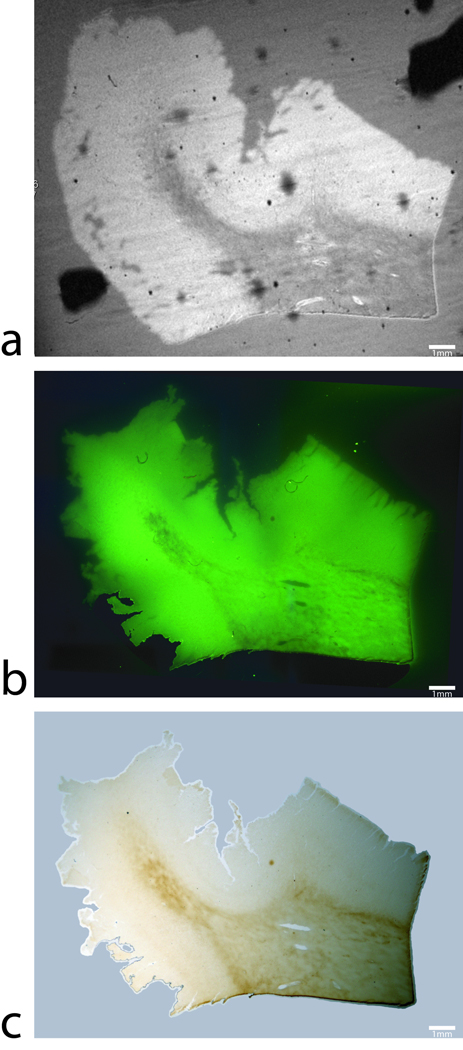
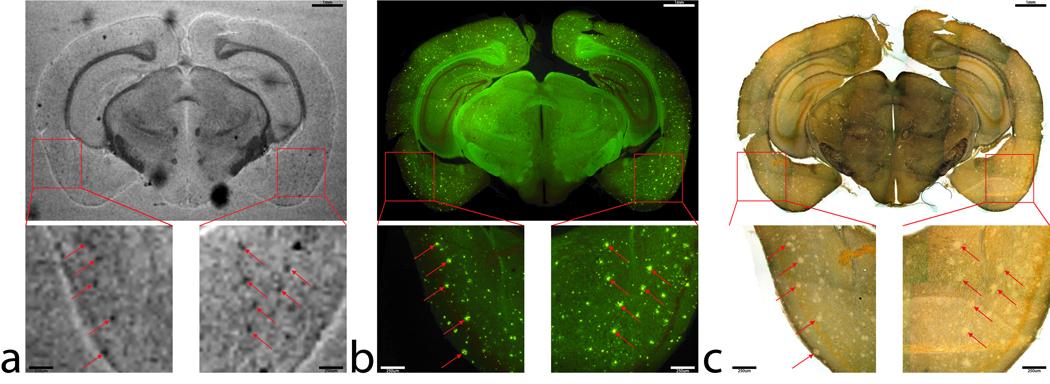
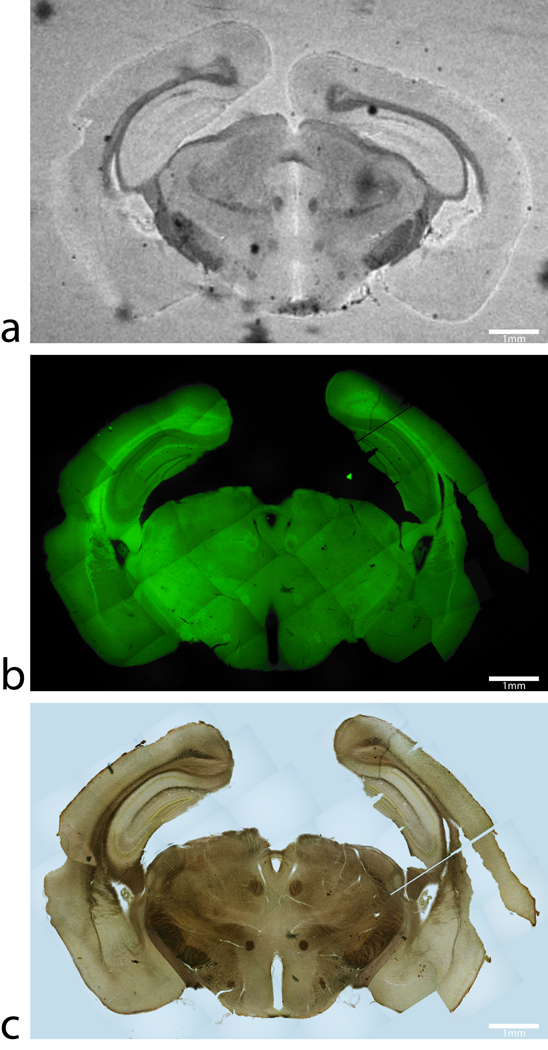
Materials and methods: With the aid of the previously developed histological coil, T(2) (*)-weighted images and R(2) (*) parametric maps were directly compared with histology stains acquired from the same set of Alzheimer's and APP/PS1 tissue slices.

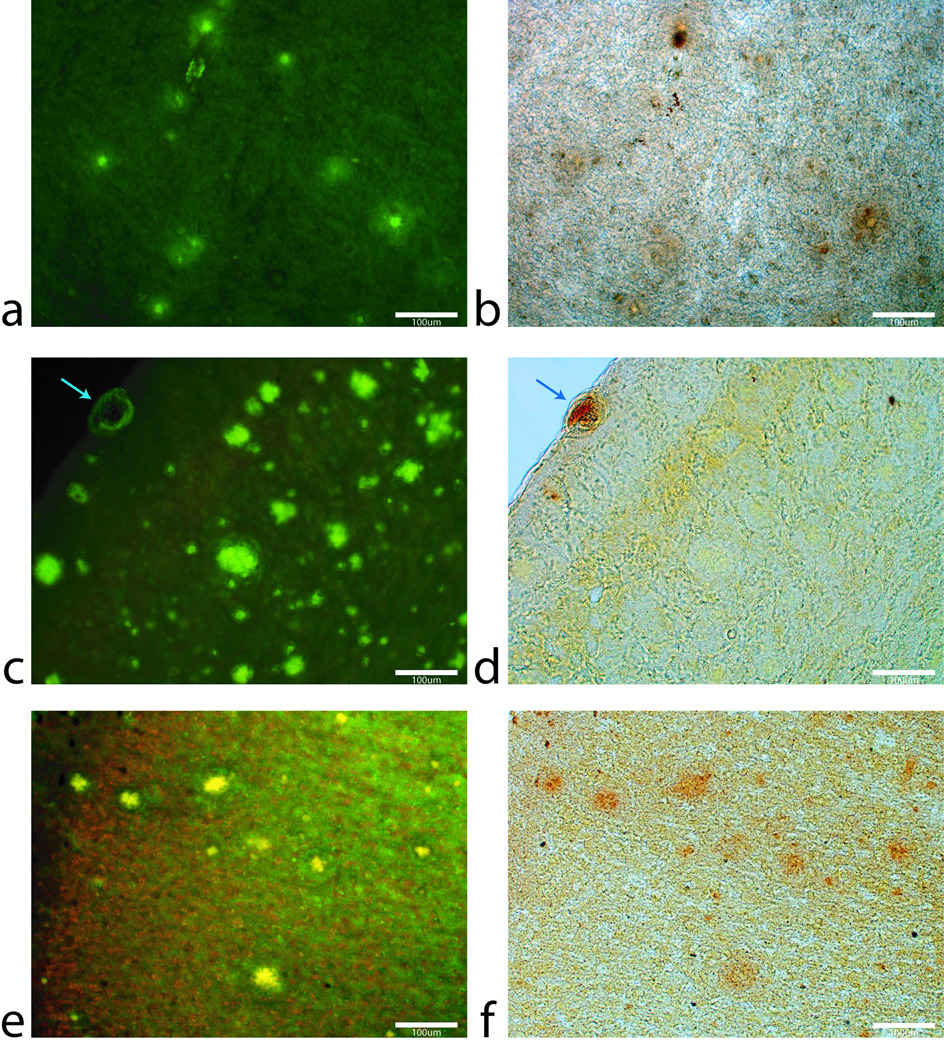
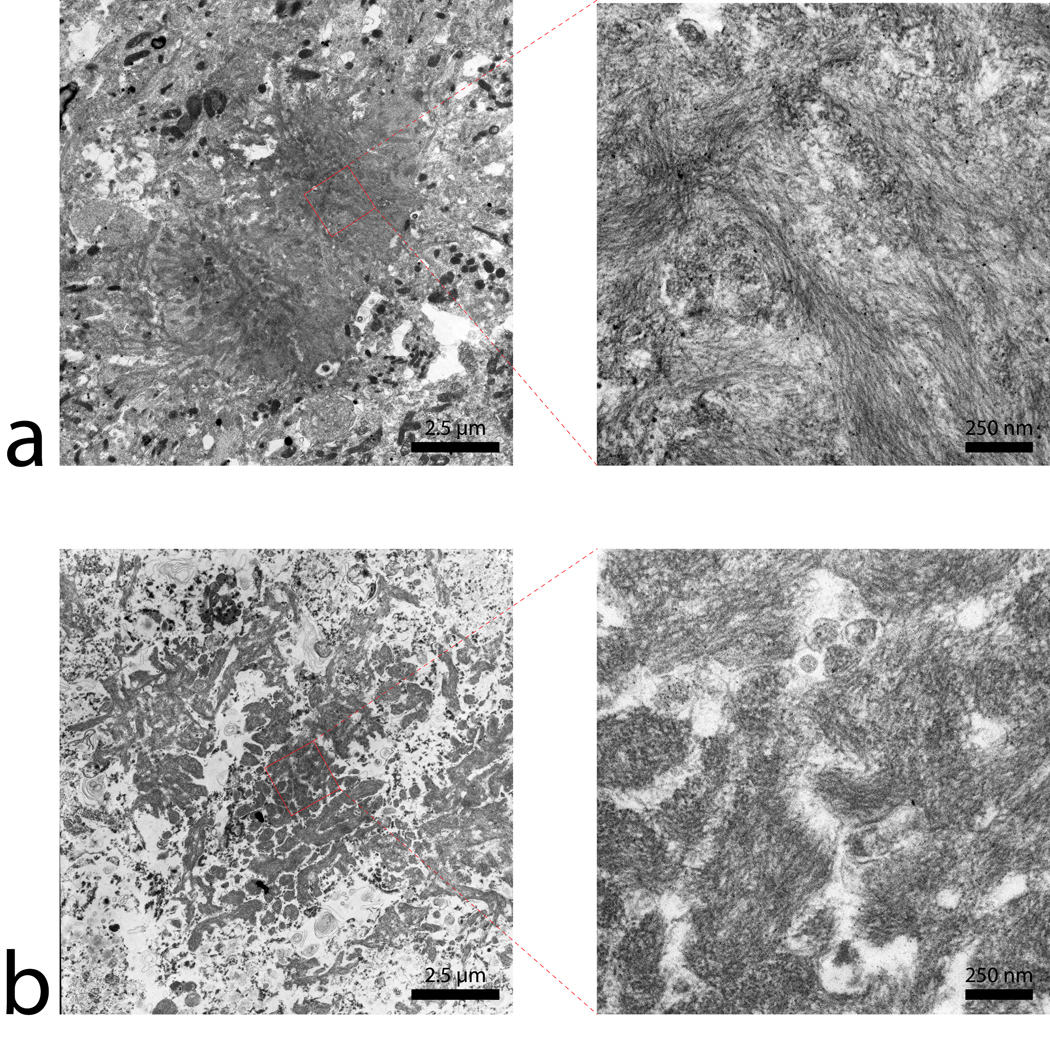
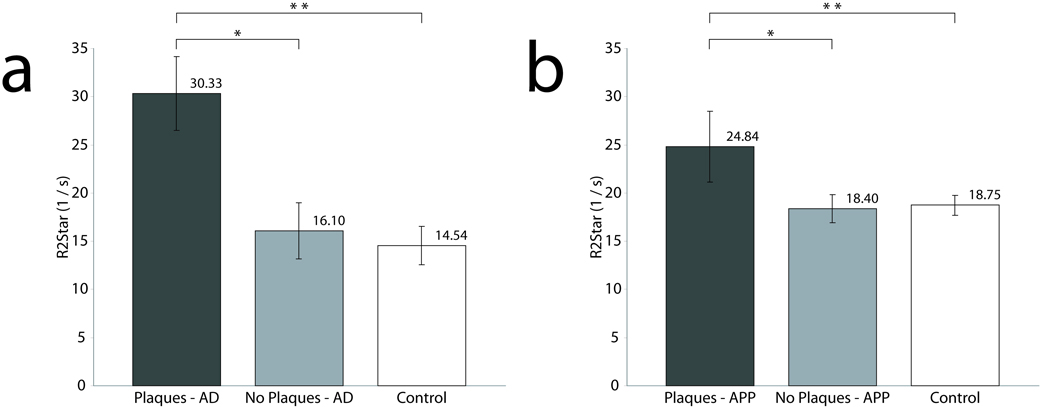
Results: The electron microscopy and histology images revealed significant differences in plaque morphology and associated iron concentration between AD and transgenic APP/PS1 mice tissue samples. For AD tissues, T(2) (*) contrast of Abeta-plaques was directly associated with the gradation of iron concentration. Plaques with significantly less iron load in the APP/PS1 animal tissues are equally conspicuous as the human plaques in the MR images.

Conclusion: These data suggest a duality in the relaxation mechanism where both high focal iron concentration and highly compact fibrillar beta-amyloid masses cause rapid proton transverse magnetization decay. For human tissues, the former mechanism is likely the dominant source of R(2) (*) relaxation; for APP/PS1 animals, the latter is likely the major cause of increased transverse proton relaxation rate in Abeta plaques. The data presented are essential for understanding the histopathological underpinning of MRI measurement associated with Abeta plaques in humans and animals.


Figures

FIG 1
FIG 1
T2* weighted MR image (a) and histological images of Thioflavin-S stain for beta-amyloid plaques (b) and (c) Perl’s iron stain of the same tissue section from the entorhinal cortex of an Alzheimer’s disease subject. For detailed comparisons, images with 40x-magnification of four selected regions outlined with red boxes are shown on both sides of the corresponding main images. A large amount of black spots can be seen clearly in the gray matter in the MR image in (a). As seen in Fig 1b in the Thioflavin-S stain images, these black spots are shown either as bright green indicating Aβ-plaques (red arrows) or dark brown indicating small blood vessels (blue arrows). The Perl’s stain of the brain tissue in (c) demonstrates focal high iron concentration in both Aβ-plaques and blood vessels. For the former, a higher iron deposition in Aβ has been previous demonstrated. For the latter, the elevated iron is likely associated with residual blood, ferritin/hemosiderin or magnetite. As seen in Fig. 1c, select hypo-intensities in the MR that are due to beta-amyloid plaques are seen with red arrows while signal dropout due to other focal iron regions are highlighted with blue arrows in the four concurrent image magnifications. The figure illustrates that hypo-intensities seen in the T2* weighted image correlate to plaque location and focal iron concentrations. Iron deposition is present in the beta-amyloid plaques that are viewable in the MR image sets. Scale bars for the magnifications are 250µm and 1mm for the whole images.
FIG 2
FIG 2
Magnetic resonance image, thioflavin-S and iron stains in human control subjects. (a) An MGE T2* weighted image, (b) thioflavin-S and (c) Perl’s iron stain of the same 60µm thick tissue section from the entorhinal cortex of an Alzheimer’s disease subject. The T2* image shows hypo-intensities that are due to micro pockets of air or coil inhomogeneities. The thioflavin-S stain illustrates a lack of beta-amyloid plaques in the human control subjects. Perl’s staining shows high iron in white matter tracks due to oligodendrocytes and one focal iron region in gray matter that is highlighted with the blue arrow in the three images and can be seen as a signal drop in the MR image. Scale bars in all images are set at 1mm.
FIG 3
FIG 3
Co-registration of (a) magnetic resonance images, (b) beta-amyloid and (c) iron stains in the APP/PS1 mouse model. (a) An MGE T2* weighted image of a 60µm slice from a APP/PS1 mouse brain a approximately −2.92mm Bregma. Final in-plane image resolution was 45µm × 45 µm. Image magnifications (40×) of the selected regions of interest within the left and right piriform cortex are seen below. Hypo-intensities are noted by red arrows. (b) Thioflavin-S fluorescent mosaic image of the same tissue section in 1a. Beta-amyloid staining is evident and can be seen as the bright green positions. The same regions as in 1a have been magnified with the arrows pointing towards the plaques responsible for the T2* weighted hypo-intensities. (c) Perl’s iron stain with the same magnifications and regions of interest arrows as in 1a and 2a. The figure illustrates that the hypo-intensities seen in the T2* weighted image are in the same region as large beta-amyloid plaques approximately 50 – 60 µm in diameter. Iron deposition is not present at the plaque locations, as they seem to be regions of low iron concentration compared to the surrounding gray matter tissue. Scales bars for the magnifications are 250 µm and 1mm for the whole image.
FIG 4
FIG 4
Magnetic resonance image, thioflavin-S and iron stains from a control C57BL/6 mouse. (a) An MGE T2* weighted image, (b) thioflavin-S, and (c) Perl’s iron stain of same 60 µm thick section of tissue from a C57BL/6 control mouse at approximately −2.80mm Bregma. The T2* weighted image shows hypo-intensities and iron staining at regions of known high iron concentration such as the substantia nigra, white matter tracks and the caudate/putamen. Thioflavin-S staining reveals only non-specific background staining with no beta-amyloid plaques in the control animals. There are no MR hypo-intensities that are associated with positive thioflavin-S staining. Scale bars in all images are 1mm.
FIG 5
FIG 5
High magnification (100×) images of beta-amyloid plaques in both human Alzheimer’s entorhinal cortex (a,b) and APP/PS1 animals piriform cortex (c,d,e,f). The thioflavin-S stain (a) and traditional Perl’s stain (b) illustrate a close relationship between beta-amyloid plaques and focal iron deposition in Alzheimer’s disease. This relationship between plaques (c) and iron (d) is not clearly seen in the APP/PS1 animals with traditional Perl’s staining. The arrow in (c) and (d) illustrate iron deposition in a capillary of the APP/PS1 animal demonstrating the positive stain for iron. Staining with a modified Perl’s technique (e,f) via degradation of the plaques’ periphery proteins allows the aqueous stain to penetrate the plaques more readily. There is an indication of minute amounts of iron in the transgenic animal plaques that is not perceivable with the traditional Perl’s stain. Differences in plaque morphology between the AD and APP/PS1 animals is evident in images (a) and (c,e). The human AD plaques have a dense core of fibrillar amyloid protein with a halo of amyloid protein around them that is less susceptible to thioflavin-S staining. APP/PS1 Aβ plaques show a larger and denser thioflavin-S positive core with a smaller halo region around them. The Perl’s stains indicate that high concentrations of iron found throughout the human AD plaques that associated with the amyloid protein or within cells such as microglia inside the space the plaque has occupied. Compared to the human AD plaques, the APP/PS1 images show a reduction in focal iron within the plaques that is diffusely found throughout the plaque. Scale bars for all images are 100µm.
FIG 6
FIG 6
Transmission electron microscope images of plaques in (a) APP/PS1 and (b) human AD tissue. The 6000× magnification images of the plaques include the whole plaque within the imaging plane. The plaque diameter for both APP/PS1 and AD tissue is approximately the same, at 10 µm. The lower magnification image illustrates the denser overall structure of the beta-amyloid plaques in the APP/PS1 compared to the human AD tissue. The human AD plaques have numerous gaps present between the fibril bundles throughout them that are rarely found in the transgenic mouse plaques. 46,000× magnification of the outlined regions reveal differences in the fibrillar orientation of the beta-amyloid strands in the APP/PS1 and AD plaques. Magnification of the outlined regions also illustrates the denser nature of the APP/PS1 plaques while the human AD tissue has gaps between amyloid strand clusters.
FIG 7
FIG 7
Bar graphs of average R2* rates from ROI’s with plaques, without plaques and control tissue within human (a) and mouse tissue (b). The R2* relaxation rate of plaque ROI’s in the AD tissue is significantly higher than both regions without plaques and control tissue sections. A similar trend is found in mouse data. There is also a higher R2* relaxation rate for the plaque ROI’s in AD than in the APP/PS1 mouse, hypothesized to be due to higher iron in the AD plaques as shown with the Perl’s stain in Fig. 5 (b,d and e).

References

    1. Benveniste H, Einstein G, Kim KR, Hulette C, Johnson GA. Detection of neuritic plaques in Alzheimer's disease by magnetic resonance microscopy. Proc Natl Acad Sci U S A. 1999;96(24):14079–14084. - PMC - PubMed
    1. Jack CR, Jr, Garwood M, Wengenack TM, Borowski B, Curran GL, Lin J, Adriany G, Grohn OH, Grimm R, Poduslo JF. In vivo visualization of Alzheimer's amyloid plaques by magnetic resonance imaging in transgenic mice without a contrast agent. Magn Reson Med. 2004;52(6):1263–1271. - PMC - PubMed
    1. Jack CR, Jr, Marjanska M, Wengenack TM, Reyes DA, Curran GL, Lin J, Preboske GM, Poduslo JF, Garwood M. Magnetic resonance imaging of Alzheimer's pathology in the brains of living transgenic mice: a new tool in Alzheimer's disease research. Neuroscientist. 2007;13(1):38–48. - PubMed
    1. Jack CR, Jr, Wengenack TM, Reyes DA, Garwood M, Curran GL, Borowski BJ, Lin J, Preboske GM, Holasek SS, Adriany G, Poduslo JF. In vivo magnetic resonance microimaging of individual amyloid plaques in Alzheimer's transgenic mice. J Neurosci. 2005;25(43):10041–10048. - PMC - PubMed
    1. Meadowcroft MD, Zhang S, Liu W, Park BS, Connor JR, Collins CM, Smith MB, Yang QX. Direct magnetic resonance imaging of histological tissue samples at 3.0T. Magn Reson Med. 2007;57(5):835–841. - PMC - PubMed

Publication types