

In vivo quantification of femoral-popliteal compression during isometric thigh contraction: Assessment using MR angiography
- PMID: 19388112
- PMCID: PMC2679167
- DOI: 10.1002/jmri.21700
In vivo quantification of femoral-popliteal compression during isometric thigh contraction: Assessment using MR angiography
Abstract
Purpose: To quantify femoral-popliteal vessel deformation during thigh contraction.
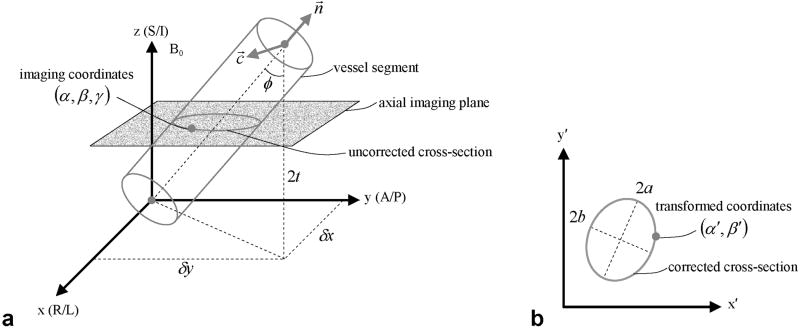
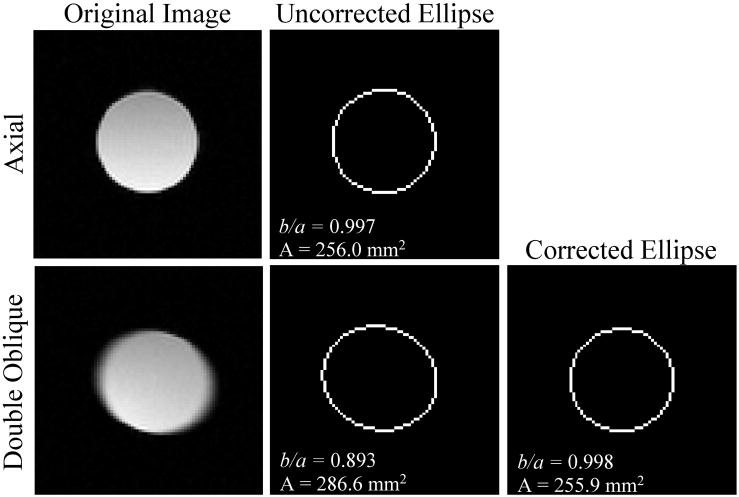
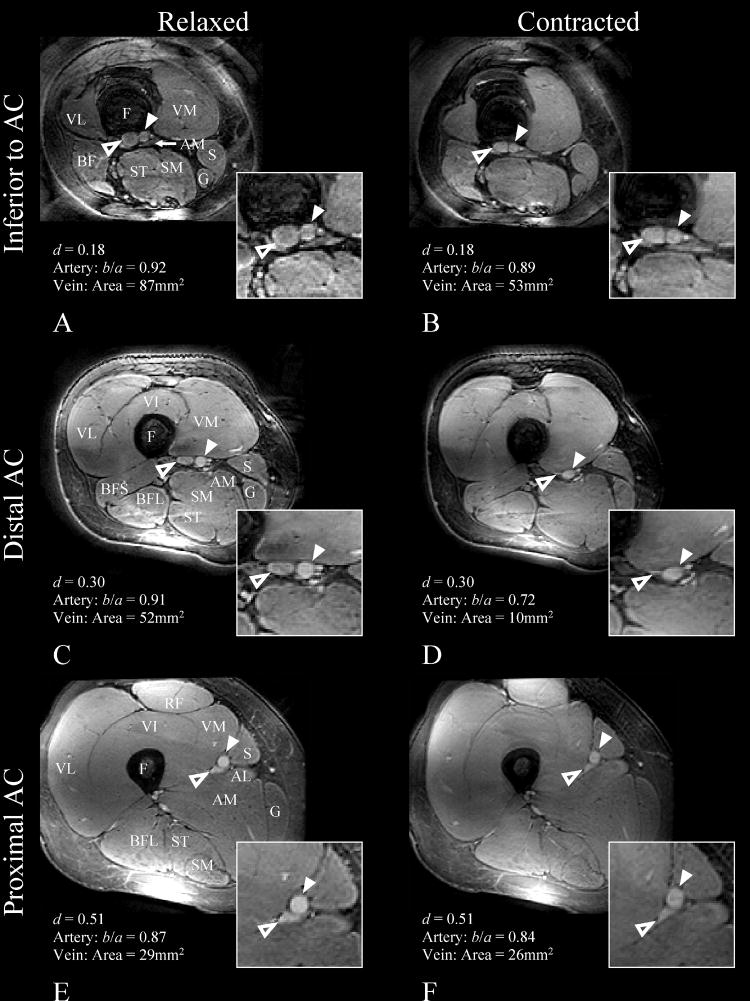
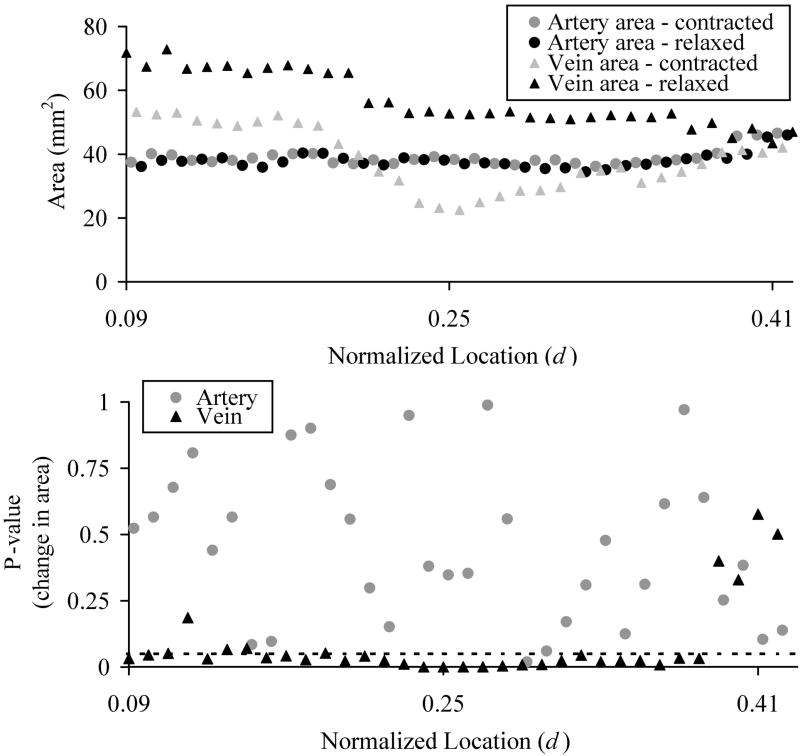
Materials and methods: Eleven subjects underwent a magnetic resonance (MR) examination of the femoral-popliteal vasculature on a 1.5 T system. A custom 3D balanced steady-state free precession (SSFP) sequence was implemented to image a 15-20-cm segment of the vasculature during relaxation and voluntary isometric thigh contraction. The arterial and venous lumina were outlined using a semiautomated method. For the artery, this outline was fit to an ellipse whose aspect ratio was used to describe arterial deformation, while venous deformation was characterized by its cross-sectional area.
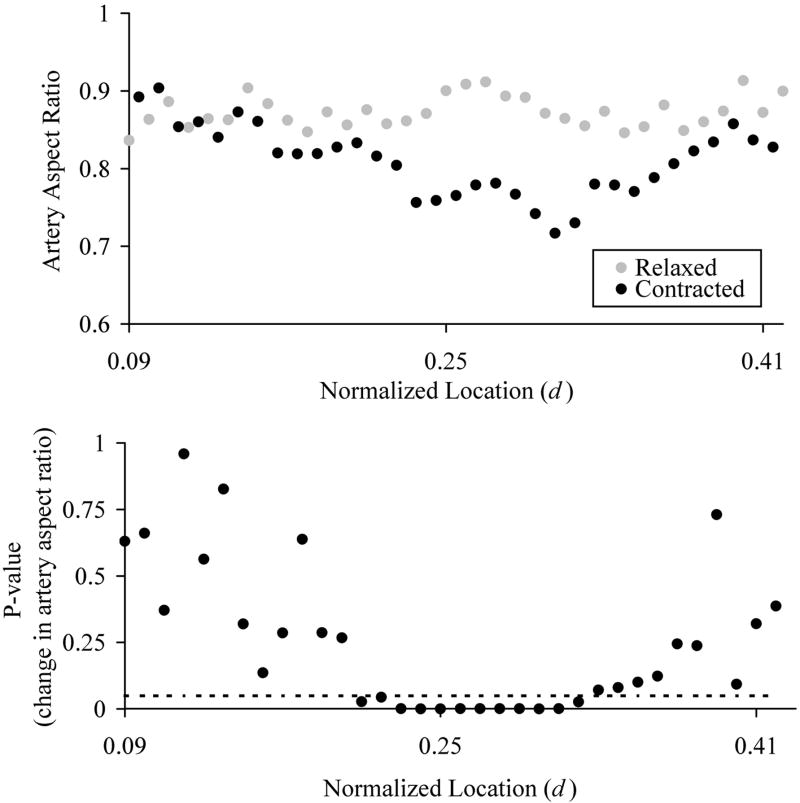
Results: Focal compression of the femoral-popliteal artery during contraction was observed 94-143 mm superior to the condyle that corresponds to the distal adductor canal (AC) immediately superior to the adductor hiatus. This was illustrated by a significant reduction (P < or = 0.05) in aspect ratio from 0.88 +/- 0.06 during relaxation to 0.77 +/- 0.09 during contraction. A negligible change in arterial aspect ratio was observed inferior to the AC and in the proximal AC. Similarly, venous area was dramatically reduced in the distal AC region during contraction.
Conclusion: Rapid 3D SSFP MR angiography of the femoral-popliteal vasculature during thigh contraction demonstrated focal compression of the artery in the distal AC region. This may help explain the high stent failure rate and the high likelihood of atherosclerotic disease in the AC. J. Magn. Reson.
Figures
Similar articles
-
Assessment of longitudinal distribution of subclinical atherosclerosis in femoral arteries by three-dimensional cardiovascular magnetic resonance vessel wall imaging.J Cardiovasc Magn Reson. 2018 Sep 3;20(1):60. doi: 10.1186/s12968-018-0482-7. J Cardiovasc Magn Reson. 2018. PMID: 30173671 Free PMC article.
-
Three-dimensional flow-independent balanced steady-state free precession vessel wall MRI of the popliteal artery: preliminary experience and comparison with flow-dependent black-blood techniques.J Magn Reson Imaging. 2011 Sep;34(3):696-701. doi: 10.1002/jmri.22663. Epub 2011 Jul 18. J Magn Reson Imaging. 2011. PMID: 21769963 Free PMC article.
-
Decreased venous contamination on 3D gadolinium-enhanced bolus chase peripheral mr angiography using thigh compression.AJR Am J Roentgenol. 2004 Oct;183(4):1041-7. doi: 10.2214/ajr.183.4.1831041. AJR Am J Roentgenol. 2004. PMID: 15385302
-
Mechanical compression during repeated sustained isometric muscle contractions and hyperemic recovery in healthy young males.J Physiol Anthropol. 2015 Oct 31;34:36. doi: 10.1186/s40101-015-0075-1. J Physiol Anthropol. 2015. PMID: 26520798 Free PMC article.
-
Peripheral arterial disease:anatomy.Major Probl Clin Surg. 1981;4:1-37. Major Probl Clin Surg. 1981. PMID: 7029155 Review. No abstract available.
Cited by
-
Features analysis of lower extremity arterial lesions in 162 diabetes patients.J Diabetes Res. 2013;2013:781360. doi: 10.1155/2013/781360. Epub 2013 Apr 15. J Diabetes Res. 2013. PMID: 23691519 Free PMC article.
-
Cross-sectional pinching in human femoropopliteal arteries due to limb flexion, and stent design optimization for maximum cross-sectional opening and minimum intramural stresses.J R Soc Interface. 2018 Aug;15(145):20180475. doi: 10.1098/rsif.2018.0475. J R Soc Interface. 2018. PMID: 30135264 Free PMC article.
References
-
- Wood NB, Zhao SZ, Zambanini A, et al. Curvature and tortuosity of the superficial femoral artery: a possible risk factor for peripheral arterial disease. J Appl Physiol. 2006;101:1412–1418. - PubMed
-
- Pedersen EM, Oyre S, Agerbaek M, et al. Distribution of early atherosclerotic lesions in the human abdominal aorta correlates with wall shear stresses measured in vivo. Eur J Vasc Endovasc Surg. 1999;18:328–333. - PubMed
-
- Kornet L, Lambregts J, Koeks A, Reneman R. Differences in near-wall shear rate in the carotid artery within subjects are associated with different intima-media thicknesses. Thromb Vasc Biol. 1998;18:1877–1884. - PubMed
-
- Gnasso A, Carallo C, Irace C, et al. Association between intima-media thickness and wall shear stress in common carotid arteries in healthy male subjects. Circulation. 1996;94:3257–3262. - PubMed
-
- Friedman MH, Bargeron CB, Deters OJ, Hutchins GM, Mark FF. Correlation between wall shear and intimal thickness at a coronary artery branch. Atherosclerosis. 1987;68:27–33. - PubMed
Publication types
MeSH terms
Grants and funding
LinkOut - more resources
Full Text Sources
