. 2009 May;29(5):1071-9.
doi: 10.1002/jmri.21737.

MRI methods for evaluating the effects of tyrosine kinase inhibitor administration used to enhance chemotherapy efficiency in a breast tumor xenograft model

Affiliations

MRI methods for evaluating the effects of tyrosine kinase inhibitor administration used to enhance chemotherapy efficiency in a breast tumor xenograft model

S O Aliu et al. J Magn Reson Imaging. 2009 May.

Abstract

Purpose: To evaluate whether quantitative MRI parameters are sensitive to the effects of the tyrosine kinase inhibitor gefitinib and can discriminate between two different treatment protocols.

Materials and methods: Untreated mice with BT474 breast tumor xenografts were characterized in a preliminary study. Subsequently, tumor volume, apparent diffusion coefficient (ADC), transendothelial permeability (K(ps)), and fractional plasma volume (fPV) were measured in three groups of mice receiving: 1) control vehicle for 10 days, or gefitinib as 2) a single daily dose for 10 days or 3) a 2-day pulsed dose.

Results: Gefitinib treatment resulted in significant tumor growth inhibition (pulsed: 439 +/- 93; daily: 404 +/- 53; control: 891 +/- 174 mm(3), P < 0.050) and lower cell density (pulsed: 0.15 +/- 0.01, daily: 0.17 +/- 0.01, control: 0.24 +/- 0.01, P < 0.050) after 9 days. Tumor ADC increased in treated groups but decreased in controls (P > 0.050). Tumor K(ps) decreased with pulsed treatment but rebounded afterwards and increased with daily treatment (P > 0.050). Tumor fPV increased in both treated groups, decreasing afterwards with pulsed treatment (P > 0.050).

Conclusion: Quantitative MRI can provide a sensitive measure of gefitinib-induced tumor changes, potentially distinguish between treatment regimens, and may be useful for determining optimal treatment scheduling for enhancing chemotherapy delivery.


Figures

Figure 1
Figure 1
Gefitinib treatment study schema. Mice in the gefitinib treatment study were treated according to three arms: daily dose (n = 6), pulsed dose (n = 6), and controls (n = 5). Mice in the daily dose treatment arm received gefitinib daily at the maximum tolerated daily dose of 150 mg/kg for 10 days. Mice in the pulsed dose treatment arm received two doses (day 2 and 3) of gefitinib at the maximum tolerated dose of 1000 mg/kg. Control mice were treated daily with vehicle carrier for 10 days. All mice were imaged at baseline, day 4, and day 9.
Figure 2
Figure 2
Tumor necrosis segmentation. a: A representative T2-weighted image of a pair of mice. Mice head (H) are indicated with arrows for orientation. Regions of interest (ROIs) were manually drawn around tumor margins on all tumor-appearing slices. The inset box demonstrates the extent of the tumor prior to ROI delineation. b: The tumor after isolation by ROI delineation. A region of central necrosis is evident. c: Pixel intensities from within the isolated tumor and with the number of clusters to be imposed served as input to the clustering algorithm. The clustering algorithm assigned pixels to clusters to minimize intra-cluster variance and generated clusters numbered 1 through 5. d: Generated clusters were visually inspected against the T2-weighted image and categorized as potentially necrotic or not. Potentially necrotic clusters were then classified as truly necrotic if pixel intensities were beyond three standard deviations from mean tumor T2-weighted intensity. Pixels belonging to necrotic clusters (clusters 1 and 4 in this case) were excluded from ADC analysis.
Figure 3
Figure 3
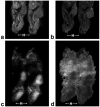
Representative MR images. a: A representative T1-weighted image for a pair of mice acquired at flip angle 40°. Mice head (H) are indicated with arrows for orientation. b: The corresponding T1 map generated from T1-weighted images acquired at flip angles of 40°, 20°, and 8°. c: A representative diffusion-weighted image (b-value = 603 s/mm2). Mice head (H) are indicated with arrows for orientation. d: The corresponding ADC map.
Figure 4
Figure 4
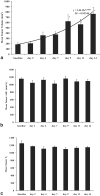
Natural history study results. a: Mean tumor volume increased exponentially in untreated mice over the course of 14 days. Tumor volumes at later timepoints (day 9, day 11, day 14) were significantly different from tumor volumes at baseline. b: Mean tumor ADC values remained relatively uniform over the course of 14 days. c: Mean tumor T1 values stabilized after a slight decrease from baseline to day 2. Error bars denote standard error. Asterisks denote statistical difference from baseline.
Figure 5
Figure 5
Gefitinib treatment study results. a: Gefitinib treatment resulted in significant tumor growth inhibition; both gefitinib treated groups were statistically different from controls at day 9. A small reduction in tumor volume is observed with pulsed treatment at day 4. The gefitinib-treated groups were not statistically different from each other. b: There was a trend of increasing ADC in both gefitinib-treated groups while ADC in controls decrease slightly. c: Mean tumor Kps decreased with pulsed treatment but rebounded afterwards and increased with daily treatment. d: Mean tumor fPV increased in both gefitinib treated groups, decreasing afterwards with pulsed treatment. Error bars denote standard error, single asterisks denote statistical difference from baseline within groups, while double asterisks denote statistical difference between groups at timepoints conjoined with braces.
Figure 6
Figure 6
H&E stains in the gefitinib treatment study (400×). Representative H&E stains of harvested tumor tissue for all three groups in the gefitinib treatment study are displayed at original magnification 400×: (a) control group, (b) daily treatment group, (c) pulsed treatment group. Gefitinib treatment resulted in significantly lower cell density in the treated groups but the treated groups were not significantly different from each other. Table 1 lists quantitative differences between the groups. Greater internuclear space was observed in the gefitinib-treated groups.
Figure 7
Figure 7
Caspase-3 stains in the gefitinib treatment study (400×). Representative anticleaved capsase-3 stains of harvested tumor tissue for all three groups in the gefitinib treatment study are displayed at original magnification 400×: (a) control group, (b) daily treatment group, (c) pulsed treatment group. Minimal apoptotic activity was detected in all three groups but no significant differences were detected between any groups. Table 1 lists quantitative differences between groups.

Similar articles

Cited by

References

    1. Yarden Y. The EGFR family and its ligands in human cancer. Signaling mechanisms and therapeutic opportunities. Eur J Cancer. 2001;37(Suppl 4):3–8. - PubMed
    1. Rose-Hellekant TA, Sandgren EP. Transforming growth factor alpha- and c-myc-induced mammary carcinogenesis in transgenic mice. Nature. 2000;19:1092–1096. - PubMed
    1. Ellis LM. Epidermal growth factor receptor in tumor angiogenesis. Hematol Oncol Clin North Am. 2004;18:1007–1021. - PubMed
    1. Kumar R, Yarmand-Bagheri R. The role of HER2 in angiogenesis. Semin Oncol. 2001;28(5 Suppl 16):27–32. - PubMed
    1. Moasser MM, Basso A, Averbuch SD, Rosen N. The tyrosine kinase inhibitor ZD1839 (“Iressa”) inhibits HER2-driven signaling and suppresses the growth of HER2-overexpressing tumor cells. Cancer Res. 2001;61:7184–7188. - PubMed

Publication types

MeSH terms