Comparative Study
. 2009 Jul;33(7):1187-96.
doi: 10.1111/j.1530-0277.2009.00942.x. Epub 2009 Apr 9.

Disparity between tonic and phasic ethanol-induced dopamine increases in the nucleus accumbens of rats

Affiliations
Comparative Study

Disparity between tonic and phasic ethanol-induced dopamine increases in the nucleus accumbens of rats

Donita L Robinson et al. Alcohol Clin Exp Res. 2009 Jul.

Abstract

Background: Dopamine concentrations in the nucleus accumbens fluctuate on phasic (subsecond) and tonic (over minutes) timescales in awake rats. Acute ethanol increases tonic concentrations of dopamine, but its effect on subsecond dopamine transients has not been fully explored.

Methods: We measured tonic and phasic dopamine fluctuations in the nucleus accumbens of rats in response to ethanol (within-subject cumulative dosing, 0.125 to 2 g/kg, i.v.).

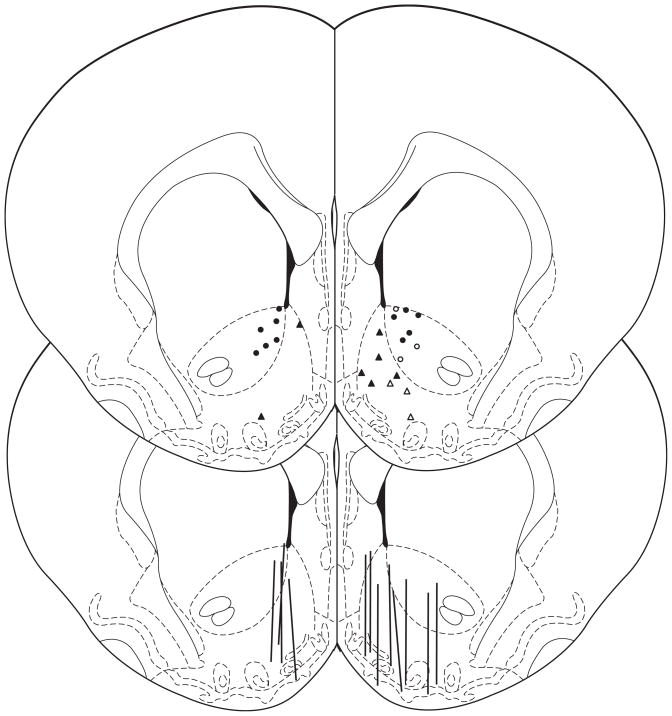
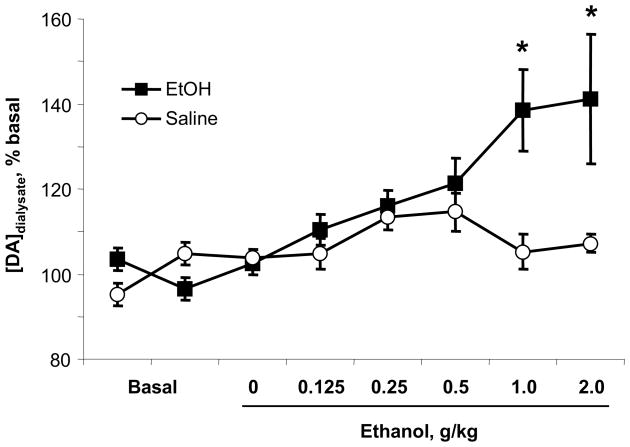
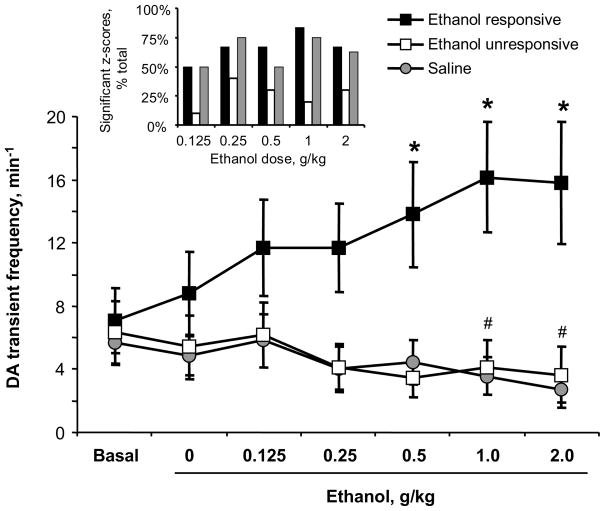
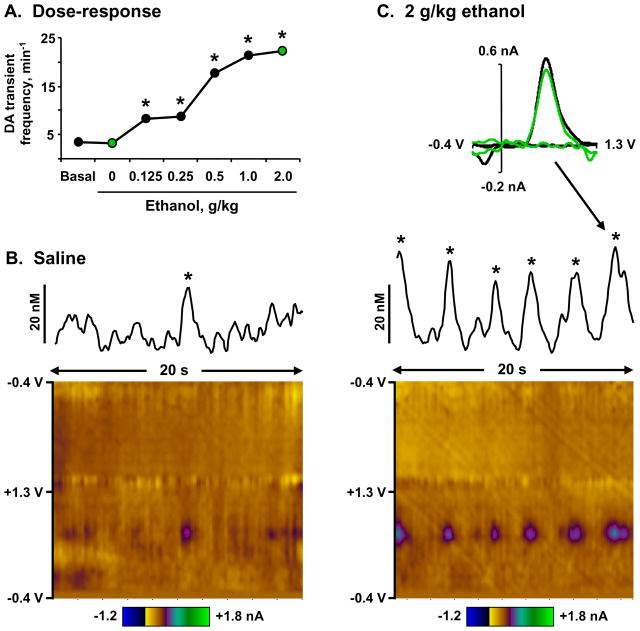
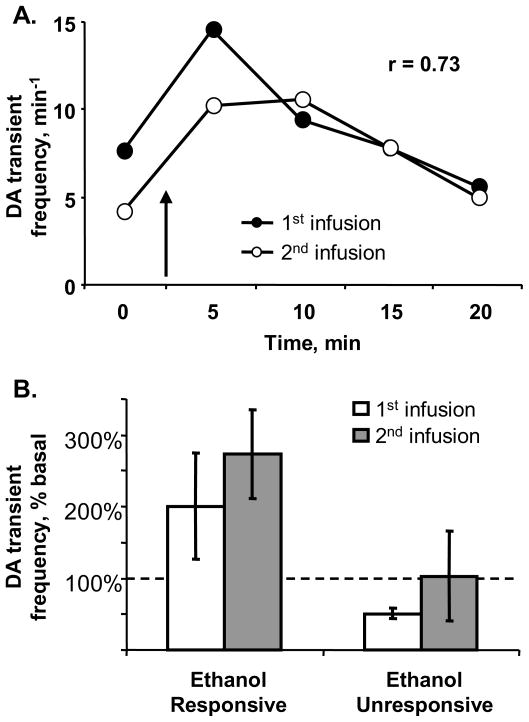
Results: Microdialysis samples yielded significant tonic increases in dopamine concentrations at 1 to 2 g/kg ethanol in each rat, while repeated saline infusions had no effect. When monitored with fast scan cyclic voltammetry, ethanol increased the frequency of dopamine transients in 6 of 16 recording sites, in contrast to the uniform effect of ethanol as measured with microdialysis. In the remaining 10 recording sites that were unresponsive to ethanol, dopamine transients either decreased in frequency or were unaffected by cumulative ethanol infusions, patterns also observed during repeated saline infusions. The responsiveness of particular recording sites to ethanol was not correlated with either core versus shell placement of the electrodes or the basal rate of dopamine transients. Importantly, the phasic response pattern to a single dose of ethanol at a particular site was qualitatively reproduced when a second dose of ethanol was administered, suggesting that the variable between-site effects reflected specific pharmacology at that recording site.

Conclusions: These data demonstrate that the relatively uniform dopamine concentrations obtained with microdialysis can mask a dramatic heterogeneity of phasic dopamine release within the accumbens.


Figures

Figure 1
Figure 1
Anatomical sites for voltammetric recording (circles, triangles) and microdialysis sampling (lines) in the NAc. For clarity, the saline groups are drawn on the left while the ethanol groups are on the right. Circles indicate core and triangles indicate shell sites for recording DA transients; open symbols indicate sites that were responsive to ethanol (i.e., exhibited significant increases in DA transient frequency after multiple ethanol infusions). The anterior/posterior position of the placements ranged from +1.0 to +2.2 mm anterior to bregma (slice shown is 1.7 mm anterior, adapted from Paxinos and Watson, 1998).
Figure 2
Figure 2
Tonic DA concentrations in the NAc across the cumulative ethanol dosing regimen measured with microdialysis. Ethanol infusion significantly increased DA concentrations at 1 and 2 g/kg (n = 8), while saline had no effect (n = 4). The concentrations are not corrected for probe recovery. * significant increase from baseline, p < 0.05.
Figure 3
Figure 3
Frequency of DA transients across the cumulative ethanol dosing regimen measured with fast scan cyclic voltammetry. Individual dose-response curves were statistically evaluated and separated into “ethanol responsive” (increased transient frequency in response to at least two doses of ethanol) or “ethanol unresponsive.” Phasic DA release increased at all doses of ethanol in responsive sites (n = 6), but not in unresponsive sites (n = 10) or in saline-treated rats (n = 8). * significant increase from baseline in ethanol-responsive group, p < 0.05; # significant decrease from baseline in saline group, p < 0.05. Inset: Histogram of significant z-scores, indicating > 2-standard-deviation changes in DA transient frequency after subsequent infusions of ethanol or saline versus baseline.
Figure 4
Figure 4
Ethanol-induced phasic DA release in the NAc core of an awake rat. Panel A. The rate of DA transients across the dosing regimen. DA transient frequency at each dose of ethanol was significantly higher than baseline and saline episodes (* all z scores < −2, p < 0.05). Frequencies during the saline and 2 g/kg episodes highlighted in panels B and C are depicted as green circles. Panel B. DA transient during a 20-s trace in the saline episode. The line graph shows current fluctuations at the oxidation potential of DA, and the confirmed DA transient is marked with an asterisk. The scale bar depicts DA concentration per unit current, as determined by in vitro calibration of the electrode. The color plot (Michael et al., 1998) shows all changes in current (color) at various applied potentials (y-axis) over time (x-axis). Fluctuations in current due to DA oxidation are best viewed at +0.65 V on the anodic scan. Panel C. Increased frequency of DA transients during a 20-s trace in the 2 g/kg episode. Data are depicted as in panel B, with the addition of a cyclic voltammogram (top) of a DA transient (green line) compared to that of electrically-stimulated DA release in the same site (black), confirming that the change in current is due to DA oxidation.
Figure 5
Figure 5
Reproducibility of ethanol-induced increases in DA transients at a single recording site. DA transients were measured before and after two infusions of 1 g/kg ethanol. Panel A. Representative data from one rat: Transient frequency was significantly higher than baseline in the 5 minutes following the initial infusion of ethanol (closed circles), an effect that was repeated 60 min later at a second infusion (open circles). Ethanol infusion is indicated by the arrow. Panel B. Group data as percent change from baseline: Sites that yielded increased rates of transients in the 5 min following the first ethanol infusion also yielded increased rates after the second infusion (“ethanol responsive,” n = 5). In contrast, sites that did not increase transient rate following the first ethanol infusion also did not increase rates after the second infusion (“ethanol unresponsive,” n = 2).

References

    1. Aragona BJ, Cleaveland NA, Stuber GD, Day JJ, Carelli RM, Wightman RM. Preferential enhancement of dopamine transmission within the nucleus accumbens shell by cocaine is attributable to a direct increase in phasic dopamine release events. J Neurosci. 2008;28:8821–8831. - PMC - PubMed
    1. Avshalumov MV, Chen BT, Marshall SP, Pena DM, Rice ME. Glutamate-dependent inhibition of dopamine release in striatum is mediated by a new diffusible messenger, H2O2. J Neurosci. 2003;23:2744–2750. - PMC - PubMed
    1. Boileau I, Assaad JM, Pihl RO, Benkelfat C, Leyton M, Diksic M, Tremblay RE, Dagher A. Alcohol promotes dopamine release in the human nucleus accumbens. Synapse. 2003;49:226–231. - PubMed
    1. Brodie MS, Shefner SA, Dunwiddie TV. Ethanol increases the firing rate of dopamine neurons of the rat ventral tegmental area in vitro. Brain Res. 1990;508:65–69. - PubMed
    1. Carelli RM, Wightman RM. Functional microcircuitry in the accumbens underlying drug addiction: insights from real-time signaling during behavior. Curr Opinion Neurobio. 2004;14:763–768. - PubMed

Publication types