

Placental biomarkers of phthalate effects on mRNA transcription: application in epidemiologic research
- PMID: 19389254
- PMCID: PMC2678110
- DOI: 10.1186/1476-069X-8-20
Placental biomarkers of phthalate effects on mRNA transcription: application in epidemiologic research
Abstract
Background: CYP19 and PPARgamma are two genes expressed in the placental trophoblast that are important to placental function and are disrupted by phthalate exposure in other cell types. Measurement of the mRNA of these two genes in human placental tissue by quantitative real-time polymerase chain reaction (qPCR) offers a source of potential biomarkers for use in epidemiologic research. We report on methodologic challenges to be considered in study design.
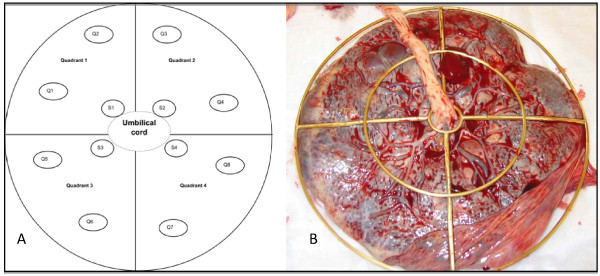
Methods: We anonymously collected 10 full-term placentas and, for each, sampled placental villi at 12 sites in the chorionic plate representing the inner (closer to the cord insertion site) and outer regions. Each sample was analyzed for the expression of two candidate genes, aromatase (CYP19) and peroxisome proliferator activated receptor protein gamma (PPARgamma) and three potential internal controls: cyclophilin (CYC), 18S rRNA (18S), and total RNA. Between and within placenta variability was estimated using variance component analysis. Associations of expression levels with sampling characteristics were estimated using mixed effects models.
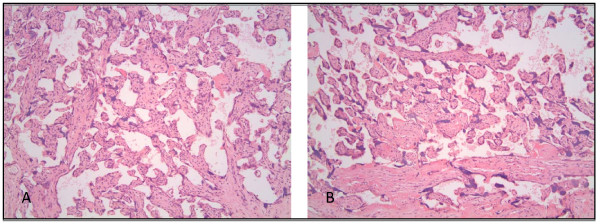
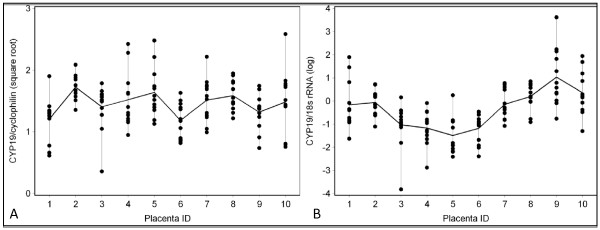
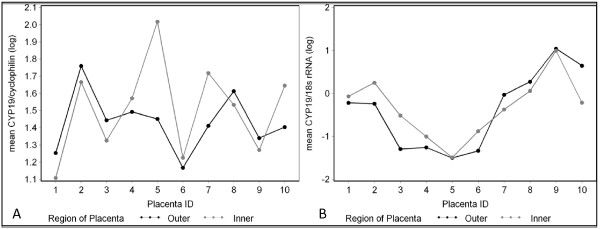
Results: We identified large within-placenta variability in both transcripts (>90% of total variance) that was minimized to <20% of total variance by using 18S as an internal control and by modelling the means by inner and outer regions. 18S rRNA was the most appropriate internal control based on within and between placenta variability estimates and low correlations of 18S mRNA with target gene mRNA. Gene expression did not differ significantly by delivery method. We observed decreases in the expression of both transcripts over the 25 minute period after delivery (CYP19 p-value for trend = 0.009 and PPARgamma (p-value for trend = 0.002). Using histologic methods, we confirmed that our samples were comprised predominantly of villous tissue of the fetal placenta with minimal contamination of maternally derived cell types.
Conclusion: qPCR-derived biomarkers of placental CYP19 and PPARgamma gene expression show high within-placental variability. Sampling scheme, selection of an appropriate internal control and the timing of sample collection relative to delivery can be optimized to minimize within-placenta and other sources of underlying, non-etiologic variability.
Figures
References
-
- Hunter CA Jr, Howard WF. Etiology of hypertension in toxemia of pregnancy. Am J Obstet Gynecol. 1961;81:441–450. - PubMed
-
- Khong TY, De Wolf F, Robertson WB, Brosens I. Inadequate maternal vascular response to placentation in pregnancies complicated by pre-eclampsia and by small-for-gestational age infants. Br J Obstet Gynaecol. 1986;93:1049–1059. - PubMed
Publication types
MeSH terms
Substances
Grants and funding
LinkOut - more resources
Full Text Sources
