. 2009 Apr 15;328(2):188-99.
doi: 10.1016/j.ydbio.2009.01.003. Epub 2009 Jan 14.

The role of Wnt5a in prostate gland development

Affiliations

The role of Wnt5a in prostate gland development

Liwei Huang et al. Dev Biol. .

Abstract

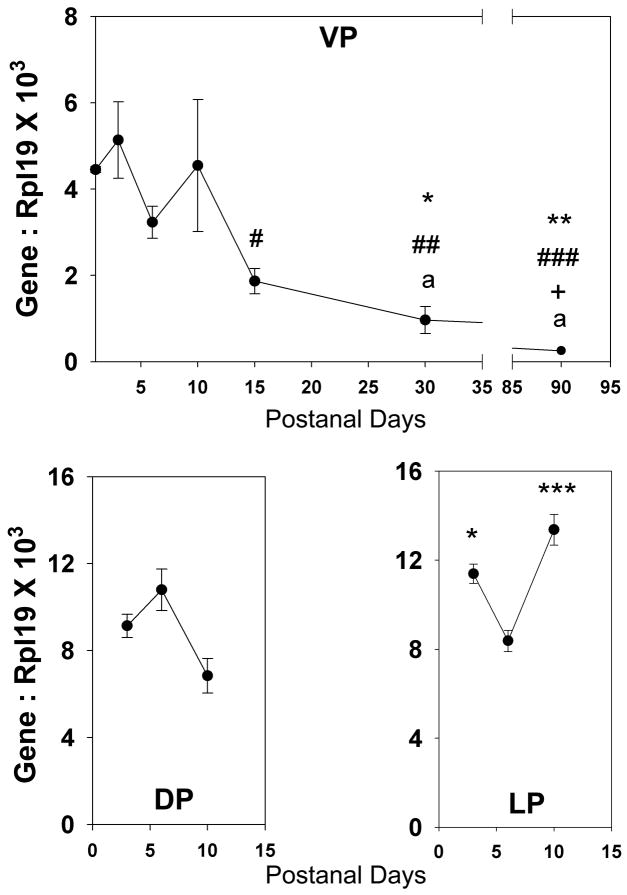
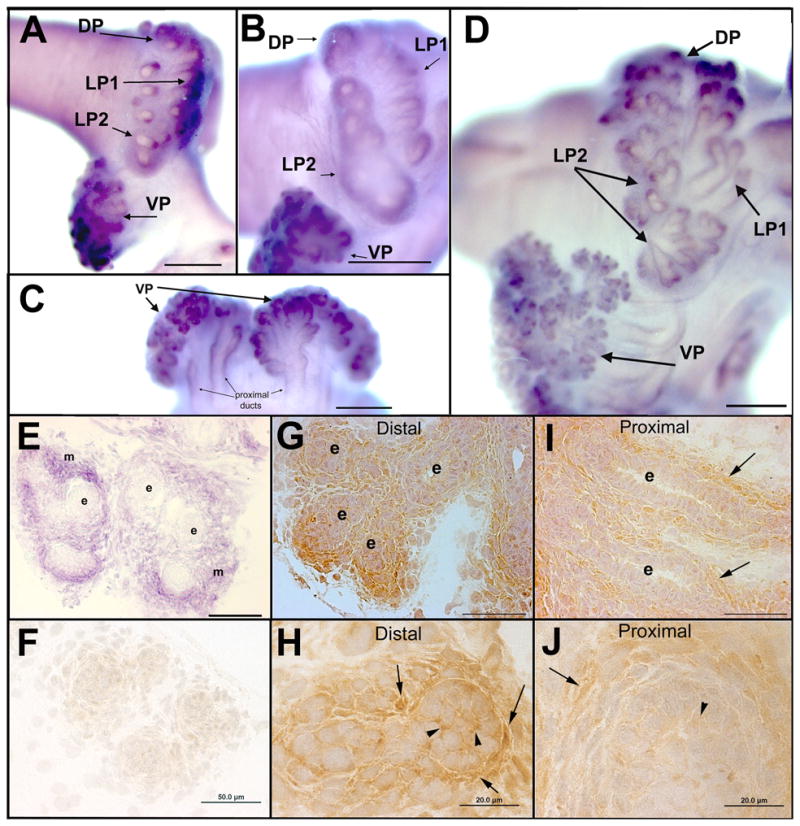
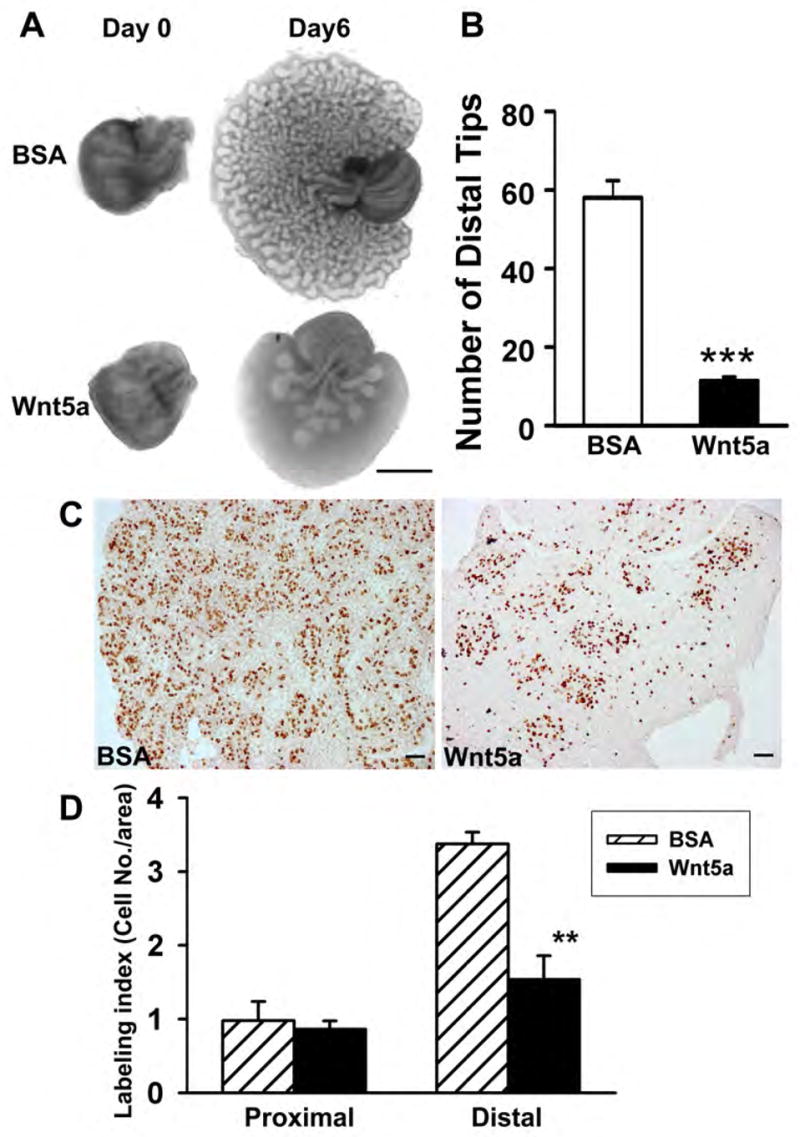
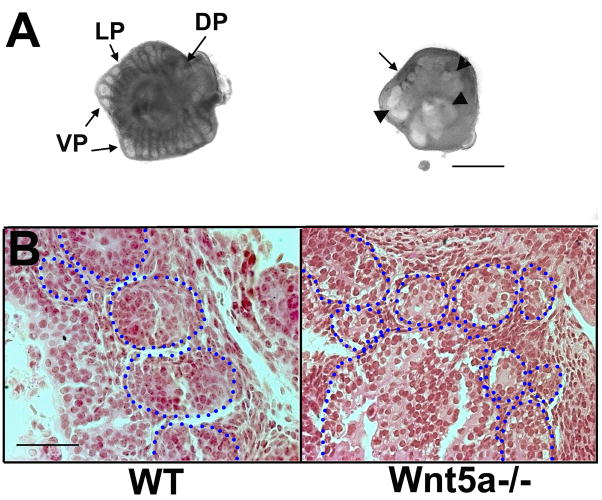
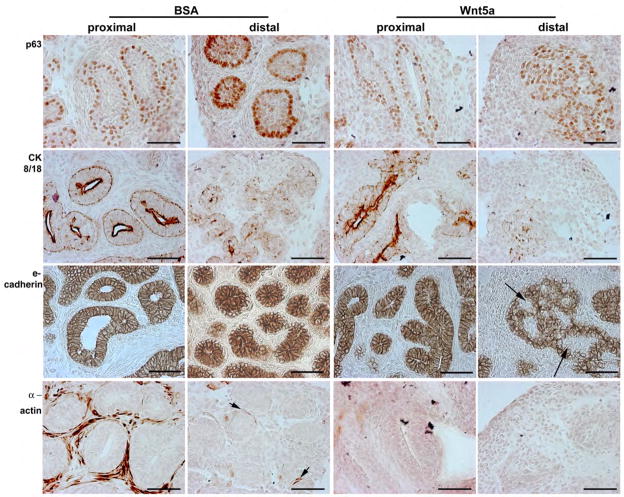
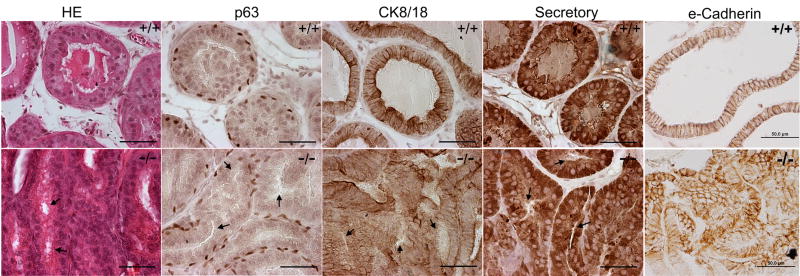
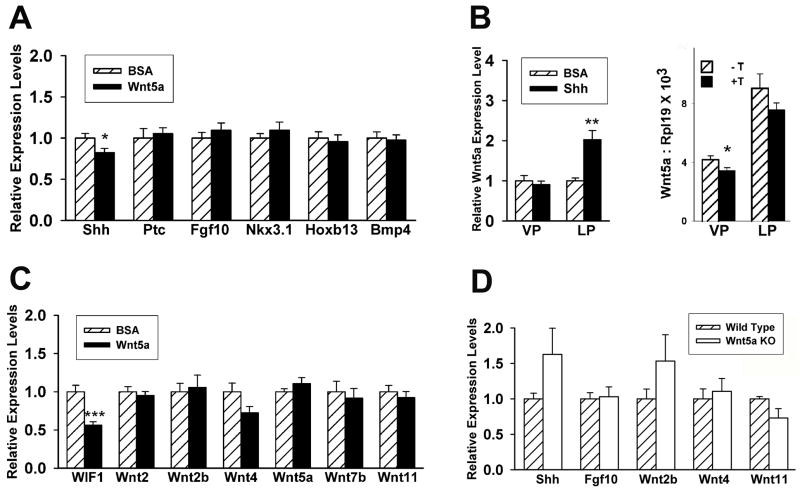
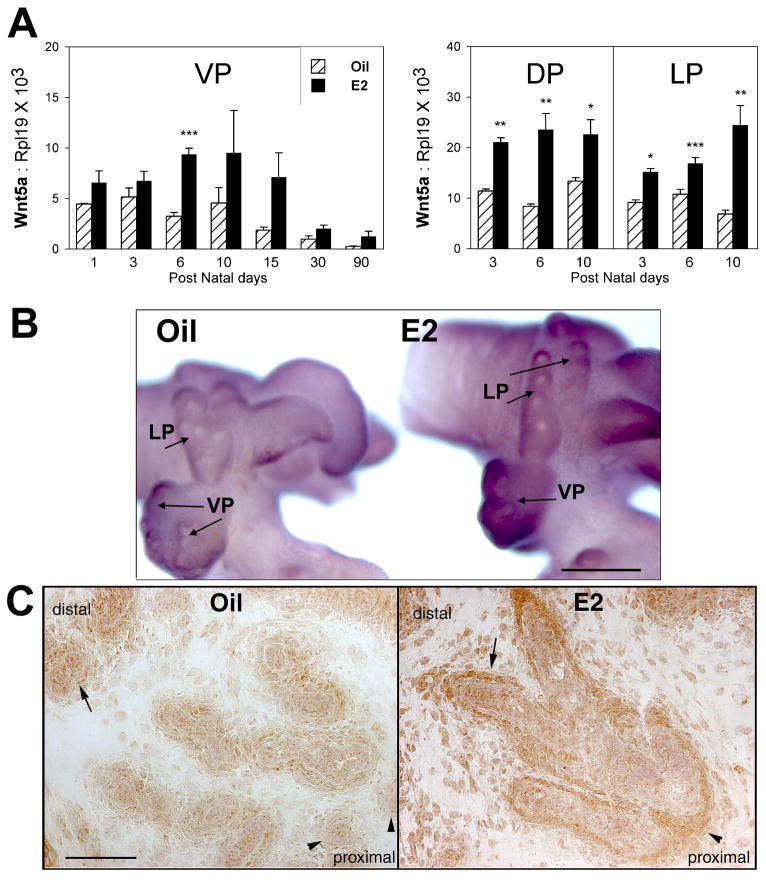
The Wnt genes encode a large family of secreted glycoproteins that play important roles in controlling tissue patterning, cell fate and proliferation during development. Currently, little is known regarding the role(s) of Wnt genes during prostate gland development. The present study examines the role of the noncanonical Wnt5a during prostate gland development in rat and murine models. In the rat prostate, Wnt5a mRNA is expressed by distal mesenchyme during the budding stage and localizes to periductal mesenchymal cells with an increasing proximal-to-distal gradient during branching morphogenesis. Wnt5a protein is secreted and localizes to periductal stroma, extracellular matrix and epithelial cells in the distal ducts. While Wnt5a expression is high during active morphogenesis in all prostate lobes, ventral prostate (VP) expression declines rapidly following morphogenesis while dorsal (DP) and lateral lobe (LP) expression remains high into adulthood. Steroids modulate prostatic Wnt5a expression during early development with testosterone suppressing Wnt5a and neonatal estrogen increasing expression. In vivo and ex vivo analyses of developing mouse and rat prostates were used to assess the functional roles of Wnt5a. Wnt5a(-/-) murine prostates rescued by organ culture exhibit disturbances in bud position and directed outgrowth leading to large bulbous sacs in place of elongating ducts. In contrast, epithelial cell proliferation, ductal elongation and branchpoint formation are suppressed in newborn rat prostates cultured with exogenous Wnt5a protein. While renal grafts of Wnt5a(-/-) murine prostates revealed that Wnt5a is not essential for cyto- and functional differentiation, a role in luminal cell polarity and lumenization of the ducts was indicated. Wnt5a suppresses prostatic Shh expression while Shh stimulates Wnt5a expression in a lobe-specific manner during early development indicating that Wnt5a participates in cross-talk with other members of the gene regulatory network that control prostate development. Although Wnt5a does not influence prostatic expression of other Wnt morphogens, it suppresses Wif-1 expression and can thus indirectly modulate Wnt signaling. In summary, the present finds demonstrate that Wnt5a is essential for normal prostate development where it regulates bud outgrowth, ductal elongation, branching, cell polarity and lumenization. These findings contribute to the growing body of knowledge on regulatory mechanisms involved in prostate gland development which are key to understanding abnormal growth processes associated with aging.


Figures

Figure 1
Figure 1
(A) Ontogeny of Wnt5a mRNA expression in the rat ventral prostate lobes as quantified by real-time RT-PCR. Wnt5a expression in the VP was high at birth and remained at high level until pnd 10. The expression level markedly declined thereafter reaching a nadir in young adulthood. Each point represents mean ± SEM for 3–9 replicates. * = P<0.05 vs pnd 1, ** = p<0.01 vs pnd 1, # = p<0.05 vs pnd 3, ## = p<0.01 vs pnd 3, ### = p<0.001 vs pnd 3, + = p<0.05 vs day 6, a = p<0.05 vs pnd 10. (B) Wnt5a expression levels in the lateral and dorsal prostate are comparable to ventral prostate expression levels during the early developmental stage. Each point represents the mean ± SEM for 3–11 replicates. * = p<0.05 vs. pnd 6, *** = p<0.001 vs pnd 6.
Figure 2
Figure 2
Localization of Wnt5a transcript (A–E) and Wnt5a protein (F–G) in the developing rat prostate gland. Wnt5a mRNA expression was examined by wmISH and exhibited a periductal pattern typical for mesenchyme-expressed genes. To allow direct comparisons of signal strength, tissues from pnd1 (A), pnd 3 (B–C) and pnd 6 (D) were processed together. Wnt5a mRNA expression localized to periductal cells along the ductal length with an increasing gradient from the proximal duct out towards the distal tips where the signal was most intense. (E) Cross-section of pnd 3 VP from wmISH confirms strong Wnt5a expression in the mesenchymal cells (m) immediately adjacent to the ducts but not in the epithelial cells (e). Wnt5a protein was localized by immunohistochemistry in pnd 6 VP tissue sections counterstained with hematoxylin. (F) Negative control IgG in place of Wnt5a on an adjacent section shows lack of signal in the mesenchymal and epithelial cells. (G–H) Low and higher power images, respectively, of Wnt5a protein localized to mesenchymal cells and extracellular matrix (arrows) and to the cell surface of epithelial (e) cells (arrowheads) in the distal VP ducts. (I–J) Wnt5a protein immunostain in the proximal VP ducts was strong in periductal mesenchyme (arrows) but negligible in the epithelium. Scale bars: A–D = 200μm; E–F, G, I = 50μm; H &J = 20μm. VP=ventral prostate, DP= dorsal prostate, LP1= lateral prostate type 1 ducts, LP2=lateral prostate type 2 ducts.
Figure 3
Figure 3
Cultured rat VP following addition of BSA (controls) or Wnt5a protein. Paired lobes from a single rat were treated with either BSA or Wnt5a (1.0 μg/ml) to permit direct comparison of Wnt5a treatment. (A) VP collected on pnd 0 and after culture for 6 days in BOCM with either BSA or Wnt5a protein. Wnt5a markedly inhibited the ductal outgrowth and branching. (B) Number of distal tips observed in 2-D photographs of VPs taken after 6 day culture with or without Wnt5a. Bars represent the mean ±SEM. ***P< 0.0001 versus BSA (n=5). (C) VPs were labeled with BrdU after 6-day culture in BSA or Wnt5a. The number of proliferating epithelial cells was greatly reduced in the central-distal epithelial ducts of Wnt5a-treated prostates as compared to BSA controls. (D) BrdU labeling index of epithelial cells in the proximal and central-distal regions of VP lobes cultured for 6 days with or without Wnt5a. The bar represents the mean ±SEM of 4 replicates. **P<0.05 versus BSA.
Figure 4
Figure 4
Kinetics of prostatic bud elongation and branching in newborn rat contralateral VPs exposed to BSA (controls) or Wnt5a protein (1 μg/ml) for 72 hr. (A) Aggregate length (μM) of all ductal segments in each successive branch generation over time. Solid lines represent data from control VPs and dotted lines represent data from Wnt5a-exposed VPs. (B) Total number of branchpoint events in each ductal generation as a function of time. Solid lines represent data from control VPs and dotted lines represent data from Wnt5a-exposed VPs. Error bars denote SEM from 6 sets of experiments. Differences between the two treatments were statistically significant (P<0.05) from 20 hr onward for both data sets.
Figure 5
Figure 5
Wnt5a+/+ (WT) and Wnt5a−/− mouse UGS-prostatic complex collected on e16.5 and cultured for 4 days in basal medium with 10−8M dihydrotestosterone. (A) The UGS from wild-type mouse (left) developed numerous and symmetric elongating buds in the dorsal (DP), lateral (LP) and ventral (VP) regions. In contrast, epithelial buds from the Wnt5a−/− UGS (right) were nonsymmetrical in position, widely varied in size from bulbous (arrowheads) to small buds (arrow) which failed to elongate. Bar = 500μM. (B) Eosin-stained cross sections of cultured prostatic tissue show numerous prostatic ducts of similar diameter in the wild-type (WT) tissue and irregular bud size and position in tissue from homozygous Wnt5a−/− mice. Blue circles outline the epithelial buds. Bar = 50 μM.
Figure 6
Figure 6
Immunohistochemistry for p63 (basal cell marker), CK8/18 (luminal cell marker), e-cadherin, and α actin (smooth muscle cell marker) in proximal and distal regions of rat VPs cultured for 6 days with BSA or Wnt5a protein. The proximal prostatic ducts contained a bilayer of epithelial cells in both treatment groups with basal cells (p63+) situated along the basement membrane and differentiating luminal cells positioned above them (apical CK8/18+ stain). Strong e-cadherin stain is observed along the lateral edges of all epithelial cells, producing a pinwheel pattern in the polarized epithelium. While lumen formation was observed in most proximal ducts of BSA-cultured VPs, those treated with Wnt5a showed exhibited limited lumenization. Strong β-actin staining was observed in proximal periductal cells of BSA control VPs indicating their differentiation to smooth muscle cells. This mesenchymal cell differentiation had not occurred by day 6 in the prostates cultured with Wnt5a. In the distal region of BSA-cultured prostates, the solid ducts were nonlumenized but showed appropriate organization and early differentiation with a continuous, single cell layer of p63+ basal cells along the basement membrane, light CK8/18 staining in the central cells. In contrast, the solid epithelial cords in the distal VPs cultured with Wnt5a were largely filled with p63+ basal cells interspersed with CK8/18+ cells and many e-cadherin negative cells (arrows) suggesting altered differentiation and inappropriate epithelial polarization. While early evidence of mesenchymal differentiation to smooth muscle cells was observed by β-actin staining in distal BSA-treated VPs (arrows), this had not occurred in Wnt5a-treated prostates. Scale bar = 50μm.
Figure 7
Figure 7
Renal grafts of Wnt5a+/+ (top row) and Wnt5a−/− knockout (bottom row) mouse prostates. The UGS/prostate complex was removed at e16.5 and grafted under the renal capsule of nude mice for 30 days. Tissues were sectioned and stained with H&E or immunostained for p63 (basal cell marker), CK8/18 (luminal cell marker), secretory DLP protein and e-cadherin. Arrows point to arrested lumen formation observed throughout sections of mutant Wnt5a−/− prostates. Photos of H&E stain,p63, CK8/18 and e-cadherin are from the VP while DLP protein IHC was taken of DLP regions of the graft. Scale bar = 50μM.
Figure 8
Figure 8
Effect of Wnt5a addition or loss on prostatic gene expression. A–C: Gene expression in newborn rat VP lobes after 18 hr organ culture as measured by real-time RT-PCR. (A) Effect of 1μg/ml Wnt5a protein on expression of multiple developmental genes. Bars represent mean ± SEM for 15 replicates. * P <0.05 BSA vs. Wnt5a protein. (B) Left: Effect of 2 μg/ml Shh protein on Wnt5a expression in the rat VP and LP after 18 h of culture. Shh increased Wnt5a expression in LP but not VP as compared to BSA controls. Bars represent the mean ± SEM for 8 samples. ** P<0.01 Shh vs. BSA. Right: Effect of 10 nM testosterone on Wnt5a expression in the rat VP and LP after 18 hr culture. Testosterone modestly suppressed Wnt5a gene expression in both lobes. Bars represent the mean ± SEM for 8 samples. ** P<0.05 -T vs +T. (C) Effect of 1μg/ml Wnt5a protein on expression of Wnt genes and WIF1 in rat VP. Bars represent mean ± SEM for 15 replicates. ** P <0.001 BSA vs. Wnt5a protein. (D) Expression of Shh, Fgf10, Wnt2b, Wnt4, Wnt5a, Wnt11 and WIF1 mRNA in wild type and Wnt5a−/− knockout mouse UGS/prostate tissues after 4 days of culture. Bars represent mean ± SEM for 6 replicates.
Figure 9
Figure 9
Effects of neonatal estradiol exposure on prostatic expression of Wnt5a in the separate rat prostate lobes. (A) Real-time RT-PCR of Wnt5a mRNA levels over time in the VP, DP and LP of rats exposed to oil or 25 μg estradiol benzoate on pnd 0, 2 and 4. Estrogen exposure resulted in a significant and sustained increase in prostatic Wnt5a expression. Bars represents the mean ± SEM of 3–10 tissues at each time point. * P< 0.05, ** P < 0.01, *** P< 0.001, Oil vs E2. (B) wmISH of Wnt5a mRNA in the pnd 3 prostatic complex of rats exposed to oil (left) or estradiol (right) on pnd 0 and 2. Tissues were processed together to permit direct comparison of signal intensity. Photos are representatives of six separate sets of tissues. Scale bar = 200μM. (C) Immunohistochemistry of Wnt5a protein in pnd 5 VPs of rats treated with oil (left) or estradiol (right) on pnd 0, 2 and 4. Photos are taken from tissues sections mounted on a single glass slide to permit direct comparisons. Wnt5a signal is observed in periductal mesenchyme (arrows) and epithelial cells in the distal ducts of control prostates and is weaker in the proximal region (arrowhead). In contrast, Wnt5a protein immunostain is increased in neonatal estradiol-exposed prostates with strong periductal signal observed in the distal (arrow) as well as proximal lobes (arrowhead). Scale bar = 100μm.

References

    1. Bejsovec A. Wnt pathway activation: New relations and locations. Cell. 2005;120:11–14. - PubMed
    1. Bourdeau V, Deschenes J, Metivier R, Nagai Y, Nguyen D, Bretschneider N, Gannon F, White JH, Mader S. Genome-wide identification of high-affinity estrogen response elements in human and mouse. Molecular Endocrinology. 2004;18:1411–1427. - PubMed
    1. Buhler TA, Dale TC, Kieback C, Humphreys RC, Rosen JM. Localization and quantification of Wnt-2 gene expression in mouse mammary development. Dev Biol. 1993;155:87–96. - PubMed
    1. Cadigan KM, Nusse R. Wnt signaling: A common theme in animal development. Genes and Development. 1997;11:3286–3305. - PubMed
    1. Chang WY, Birch L, Woodham C, Gold LI, Prins GS. Neonatal estrogen exposure alters the transforming growth factor-β signaling system in the developing rat prostate and blocks the transient p21cip1/wafl expression associated with epithelial differentiation. Endocrinology. 1999;140:2801–2813. - PubMed

Publication types

MeSH terms

LinkOut - more resources