Comparative Study
. 2009 Jun 26;284(26):17835-45.
doi: 10.1074/jbc.M109.011502. Epub 2009 Apr 22.

The structure of the bacterial oxidoreductase enzyme DsbA in complex with a peptide reveals a basis for substrate specificity in the catalytic cycle of DsbA enzymes

Affiliations
Comparative Study

The structure of the bacterial oxidoreductase enzyme DsbA in complex with a peptide reveals a basis for substrate specificity in the catalytic cycle of DsbA enzymes

Jason J Paxman et al. J Biol Chem. .

Abstract

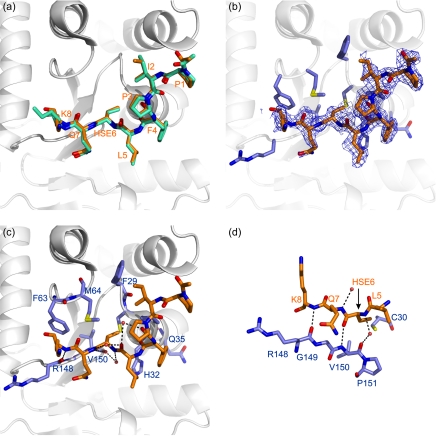
Oxidative protein folding in Gram-negative bacteria results in the formation of disulfide bonds between pairs of cysteine residues. This is a multistep process in which the dithiol-disulfide oxidoreductase enzyme, DsbA, plays a central role. The structure of DsbA comprises an all helical domain of unknown function and a thioredoxin domain, where active site cysteines shuttle between an oxidized, substrate-bound, reduced form and a DsbB-bound form, where DsbB is a membrane protein that reoxidizes DsbA. Most DsbA enzymes interact with a wide variety of reduced substrates and show little specificity. However, a number of DsbA enzymes have now been identified that have narrow substrate repertoires and appear to interact specifically with a smaller number of substrates. The transient nature of the DsbA-substrate complex has hampered our understanding of the factors that govern the interaction of DsbA enzymes with their substrates. Here we report the crystal structure of a complex between Escherichia coli DsbA and a peptide with a sequence derived from a substrate. The binding site identified in the DsbA-peptide complex was distinct from that observed for DsbB in the DsbA-DsbB complex. The structure revealed details of the DsbA-peptide interaction and suggested a mechanism by which DsbA can simultaneously show broad specificity for substrates yet exhibit specificity for DsbB. This mode of binding was supported by solution nuclear magnetic resonance data as well as functional data, which demonstrated that the substrate specificity of DsbA could be modified via changes at the binding interface identified in the structure of the complex.


Figures

FIGURE 1.
FIGURE 1.
The catalytic cycle of DsbA. a, oxidized DsbA reacts with a variety of substrate proteins to generate a mixed disulfide DsbA-substrate complex (b). The complex is rapidly resolved with release of oxidized substrate and reduced DsbA (c). Reduced DsbA reacts specifically with membrane-bound DsbB to form a mixed disulfide DsbA-DsbB complex (d), which results in reoxidation of DsbA and reduction of DsbB.
FIGURE 2.
FIGURE 2.
Oxidation of the SigA peptide by DsbA. Oxidase activity was determined by monitoring the oxidation of SigA peptide substrate. The kinetics of the oxidation reactions were determined using stopped-flow fluorescence by monitoring the increase in fluorescence upon reduction of EcDsbA (1 μm) in the assay. Progress curves for oxidation of the peptide substrate are shown at increasing peptide concentrations (0, 2, 5, and 10 μm). The rate of oxidation increases with increasing peptide concentration.
FIGURE 3.
FIGURE 3.
Analysis of the DsbA-peptide crystal. a, analysis by SDS-PAGE (lane ii) revealed that approximately half of the EcDsbA in the crystal had formed a covalent complex with the peptide. The peptide-DsbA complex (lane iii) was clearly resolved from free EcDsbA (lane iv) under the conditions used to run the gel. (Molecular weight markers are shown in lane i.) b, ribbon diagram of EcDsbA (Protein Data Bank code 3DKS, chain C). Each of the four molecules in the asymmetric unit adopted a typical DsbA fold comprising a thioredoxin (blue) and α-helical (magenta) domains and the insertion points (orange). The sulfur atoms of the active site cysteine residues are shown in yellow CPK representation.
FIGURE 4.
FIGURE 4.
The substrate binding site of DsbA. a, comparison of the peptide conformation in the two models of the EcDsbA-peptide complex (Protein Data Bank code 3DKS). Peptide chains E and F are shown in orange and green stick representation, respectively, and the residues are labeled in orange. The EcDsbA molecule to which peptide E is covalently attached (chain C) is shown in a schematic diagram. b, omit (2FoFc) electron density map (contoured at 0.8 σ) for the peptide (chain E). EcDsbA residues in contact with the peptide are shown in a blue stick representation. c, polar interactions observed in the complex are shown as black dotted lines between the interacting residues. Water atoms are shown as red spheres. The EcDsbA-peptide complex (chains C and E) is shown in the same orientation as above, and EcDsbA residues are labeled in blue. d, the peptide forms an antiparallel interaction with residues in the cis-proline loop of EcDsbA. Polar interactions are shown as black dotted lines between the peptide (in orange) and EcDsbA (in blue).
FIGURE 5.
FIGURE 5.
Analysis of EcDsbA-SigA peptide interaction by NMR spectroscopy. a, EcDsbA residues for which chemical shift perturbations are observed upon the addition of the peptide are colored in magenta on the crystal structure of the EcDsbA-peptide complex (Protein Data Bank code 3DKS, chain C; the peptide 3DKS, chain E, is in orange stick format). His32, which is not observed in either HSQC spectrum is colored in cyan. A continuous surface is formed by residues that form the EcDsbA-peptide interface in the crystal. b, 15N HSQC spectrum of EcDsbA in the absence (magenta) and presence (cyan) of SigA peptide. The expansion demonstrates perturbations that are observed for some residues (e.g. Phe29 and Cys33), whereas other residues (e.g. Gly6 and Asp86) are unaffected.
FIGURE 6.
FIGURE 6.
Comparison of the complexes of substrate-DsbA and DsbB-DsbA (Protein Data Bank code 2HI7). a, surface view of the interaction between EcDsbA and SigA peptide. The surface of EcDsbA is shown with the SigA peptide in an orange stick representation. The position of His32 on the surface is highlighted in magenta. b, structure of the DsbA-DsbB complex. The surface of EcDsbA is shown with the bound Cys104 loop in a green stick representation, and the position of His32 is highlighted. c, superposition of the two complexes reveals that His32 in the complex with SigA peptide (magenta) adopts a different rotameric state compared with that observed in the complex with DsbB.
FIGURE 7.
FIGURE 7.
Phenotypic analysis of chimeric DsbA. a, primary structure of EcDsbA, NmDsbA1, and NmDsbA2. Residues comprising the thioredoxin domain of EcDsbA are underlined. Residues that make contacts to the peptide substrate in the crystal structure of the complex are highlighted (*). b–e, phenotypic assays on dsbA E. coli (JCB571) complemented with different DsbA proteins. b, JCB571 alone (lane 3), JCB571 complemented with EcDsbA in pTrc99A as a positive control (lane 4), and JCB571 complemented with EcTDNmDsbA1α (lane 1) or EcTDNmDsbA2α (lane 2) were able to grow on LB agar without DTT, indicating that each of the cell lines was viable. c, the same cell lines were tested for growth on LB agar containing 15 mm DTT and 1 mm isopropyl 1-thio-β-d-galactopyranoside to induce DsbA expression. Each of the cell lines that had been complemented with the DsbA proteins grew, whereas JCB571 did not, indicating that each construct expressed an active DsbA. d, neither JCB571 (zone 2) nor JCB571 complemented with EcTDNmDsbA1α (zone 3) was motile. In contrast, the positive control (JCB571 complemented with EcDsbA) (zone 1) was motile. e, both the positive control strain (zone 1) and JCB571 complemented with EcTDNmDsbA2α (zone 3) were motile, whereas JCB571 (zone 2) was not.

References

    1. Collet J. F., Bardwell J. C. ( 2002) Mol. Microbiol. 44, 1– 8 - PubMed
    1. Bardwell J. C., Lee J. O., Jander G., Martin N., Belin D., Beckwith J. ( 1993) Proc. Natl. Acad. Sci. U. S. A. 90, 1038– 1042 - PMC - PubMed
    1. Heras B., Shouldice S. R., Totsika M., Scanlon M. J., Schembri M. A., Martin J. L. ( 2009) Nat. Rev. Microbiol. 7, 215– 225 - PubMed
    1. Ha U. H., Wang Y., Jin S. ( 2003) Infect. Immun. 71, 1590– 1595 - PMC - PubMed
    1. Dacheux D., Epaulard O., de Groot A., Guery B., Leberre R., Attree I., Polack B., Toussaint B. ( 2002) Infect. Immun. 70, 3973– 3977 - PMC - PubMed

Publication types

MeSH terms

Associated data

LinkOut - more resources