. 2009 Jun 19;284(25):16848-16859.
doi: 10.1074/jbc.M109.006650. Epub 2009 Apr 22.

Adipose triglyceride lipase is implicated in fuel- and non-fuel-stimulated insulin secretion

Affiliations

Adipose triglyceride lipase is implicated in fuel- and non-fuel-stimulated insulin secretion

Marie-Line Peyot et al. J Biol Chem. .

Abstract

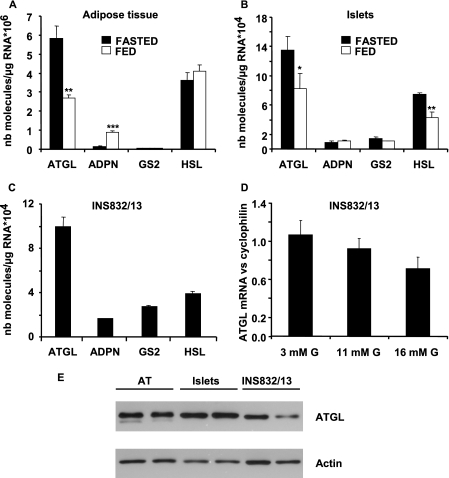
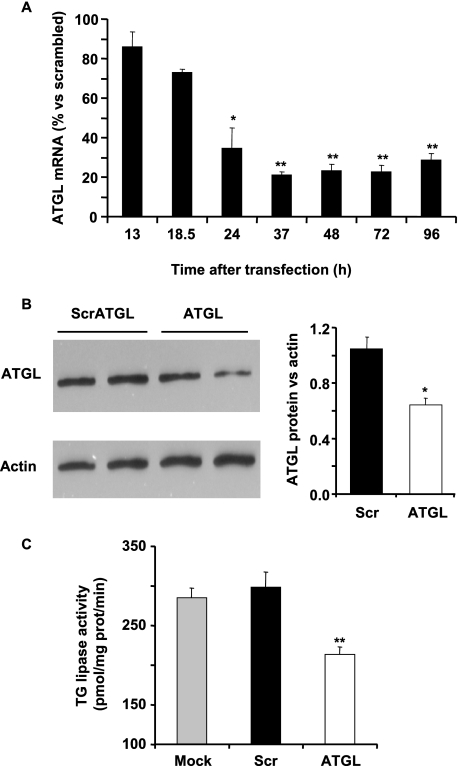
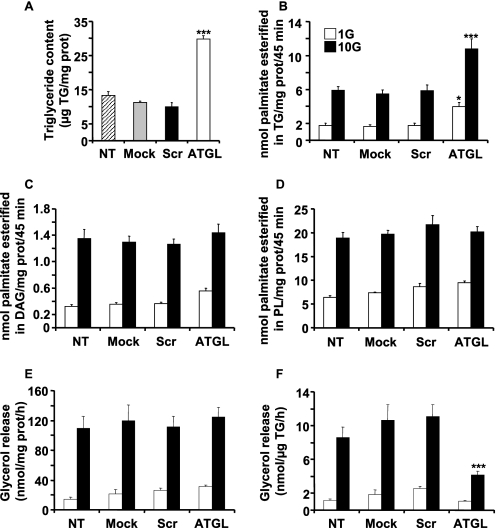
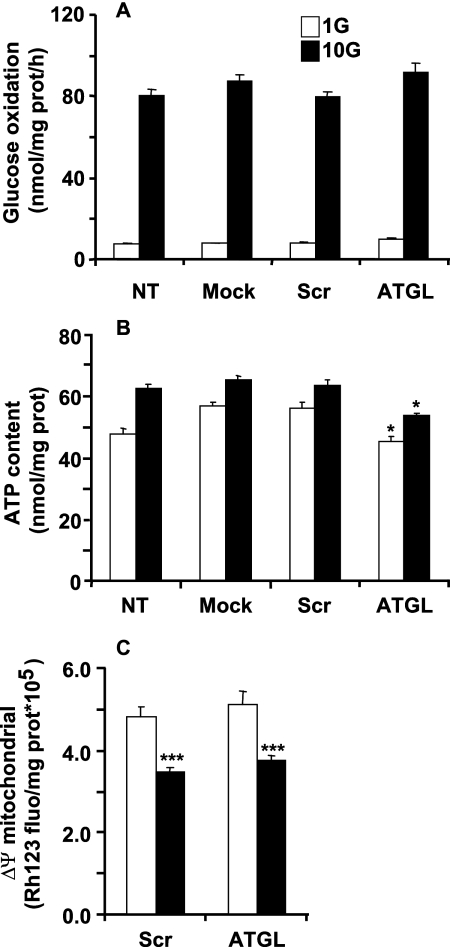
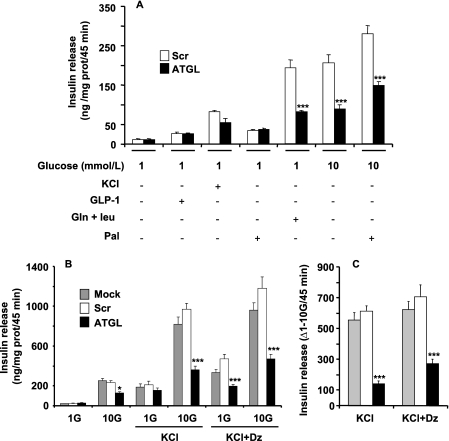
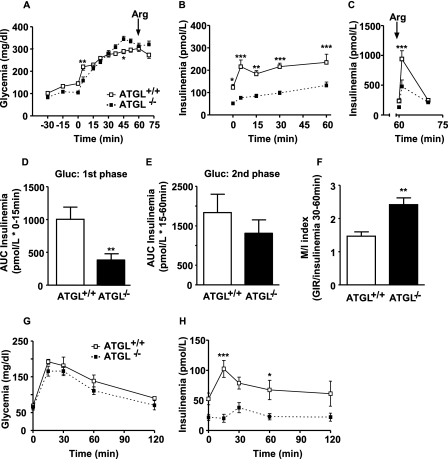
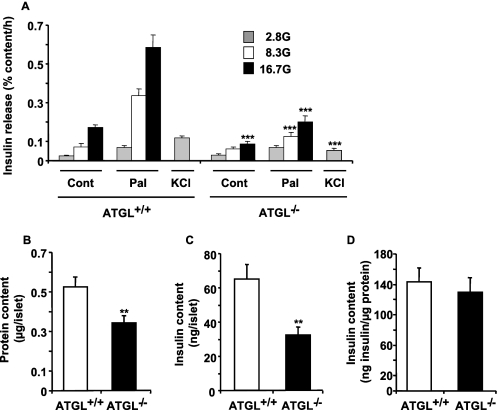
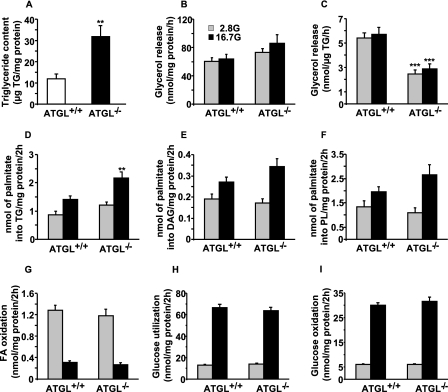
Reduced lipolysis in hormone-sensitive lipase-deficient mice is associated with impaired glucose-stimulated insulin secretion (GSIS), suggesting that endogenous beta-cell lipid stores provide signaling molecules for insulin release. Measurements of lipolysis and triglyceride (TG) lipase activity in islets from HSL(-/-) mice indicated the presence of other TG lipase(s) in the beta-cell. Using real time-quantitative PCR, adipose triglyceride lipase (ATGL) was found to be the most abundant TG lipase in rat islets and INS832/13 cells. To assess its role in insulin secretion, ATGL expression was decreased in INS832/13 cells (ATGL-knockdown (KD)) by small hairpin RNA. ATGL-KD increased the esterification of free fatty acid (FFA) into TG. ATGL-KD cells showed decreased glucose- or Gln + Leu-induced insulin release, as well as reduced response to KCl or palmitate at high, but not low, glucose. The K(ATP)-independent/amplification pathway of GSIS was considerably reduced in ATGL-KD cells. ATGL(-/-) mice were hypoinsulinemic and hypoglycemic and showed decreased plasma TG and FFAs. A hyperglycemic clamp revealed increased insulin sensitivity and decreased GSIS and arginine-induced insulin secretion in ATGL(-/-) mice. Accordingly, isolated islets from ATGL(-/-) mice showed reduced insulin secretion in response to glucose, glucose + palmitate, and KCl. Islet TG content and FFA esterification into TG were increased by 2-fold in ATGL(-/-) islets, but glucose usage and oxidation were unaltered. The results demonstrate the importance of ATGL and intracellular lipid signaling for fuel- and non-fuel-induced insulin secretion.


Figures

FIGURE 1.
FIGURE 1.
ATGL expression relative to other triglyceride lipases in adipose tissue, islets, and INS832/13 cells and its regulation by the dietary state. ATGL, adiponutrin (ADPN), GS2, and HSL mRNA levels were determined by real time RT-PCR in adipose tissue (A) and islets (B) from overnight fasted and fed rats, and in INS832/13 cells cultured in complete RPMI medium at 11.1 mm glucose (C). The effect of glucose on ATGL expression was studied in INS832/13 exposed for 24 h at 3, 11, or 16 mm glucose (G) in complete RPMI medium and normalized to cyclophilin (D). Immunoblot analysis of ATGL (E) in adipose tissue (AT) (adipose tissue from two different rats, 1st and 2nd lanes), rat islets (two different rats, 3rd and 4th lanes), and INS832/13 cells (two different passages, 5th and 6th lanes) is shown. The data are expressed as means ± S.E. of four rats (A and B) or four different passages for INS832/13 cells (C and D). *, p < 0.05; **, p < 0.01; ***, p < 0.001 versus nutritional state, by unpaired two-tailed Student's t test. NB, number.
FIGURE 2.
FIGURE 2.
shATGL treatment of INS832/13 cells reduces the expression of ATGL mRNA and protein and decreases TG lipase activity. INS832/13 cells were electroporated in the presence of empty vector (Mock), scrATGL (Scr), or shATGL. Nontransfected cells served as additional control. A, time course of the effect of shATGL on ATGL mRNA expression in INS832/13 cells cultured in complete RPMI medium at 11.1 mm glucose. B, ATGL protein expression was determined by Western blot analysis using actin as a control. C, triglyceride lipase activity of cytosolic extracts of INS832/13 cells using radiolabeled triolein as a substrate. Means ± S.E. are of three experiments performed in duplicate. *, p < 0.05; **, p < 0.01; ***, p < 0.001 versus time 13 h after transfection (A) or versus scrambled ATGL (B and C), by unpaired two-tailed Student's t test.
FIGURE 3.
FIGURE 3.
Knockdown of ATGL expression in INS832/13 cells increases FA esterification into TG and causes TG deposition. Cellular TG content was measured 96 h post-transfection with scrATGL, shATGL, or under mock or nontransfected (NT) conditions (A). Means ± S.E. are of 15 different wells in four separate experiments. B–D, cells were incubated for 45 min in KRBH containing [1-14C]palmitate at 1 and 10 mm glucose (G). B–D show palmitate esterification into TG (B), DAG (C), and PL (D). Means ± S.E. of three independent experiments are done in triplicate. Glycerol release is shown in E and F and expressed per protein content (E) or per TG content (F). Data represent means ± S.E. of five independent experiments performed in duplicate or triplicate. *, p < 0.05; **, p < 0.01; ***, p < 0.001 versus scrambled ATGL for the same glucose concentration, one way-ANOVA, Bonferroni post hoc test.
FIGURE 4.
FIGURE 4.
Decreased ATGL expression in INS832/13 cells does not affect glucose and mitochondrial metabolism. Nontransfected cells (NT) or INS832/13 cells were subjected to electroporation in the presence of either control (mock and scrATGL), or shATGL plasmids were cultured for 96 h prior to experiments. A, glucose (G) oxidation was measured in cells incubated for 2 h in KRBH at 1 or 10 mm glucose with [U-14C]glucose. Means ± S.E. are of nine separate determinations in three independent experiments. B, total ATP content was determined in cells incubated for 10 min in KRBH at 1 or 10 mm glucose. Means ± S.E. are of 18 separate determinations in three independent experiments. C, mitochondrial membrane potential was monitored as rhodamine 123 fluorescence. After dye loading, basal fluorescence was determined in cells cultured at 1 mm glucose, and then fluorescence was recorded for 10 min at 10 mm glucose. Means ± S.E. are of 12 separate determinations in two independent experiments. *, p < 0.05 versus scrambled ATGL for the same glucose concentration; ***, p < 0.001 versus 1 mm glucose for the same group; one way-ANOVA, Bonferroni post hoc test.
FIGURE 5.
FIGURE 5.
ATGL knockdown in INS832/13 cells reduces fuel-induced insulin secretion. A, insulin release was measured in mock, scrATGL, and shATGL cells incubated as indicated for 45 min at 1 or 10 mm glucose with 0.5% d-BSA in the presence or absence of 0.25 mm palmitate (Pal), 10 nm GLP-1, 35 mm KCl, or 5 mm glutamine plus 5 mm leucine. B, effect of ATGL knockdown on the KATP-independent/amplification pathway(s) of insulin secretion was determined in cells incubated at 1 or 10 mm glucose (G) in the presence or absence of 35 mm KCl with or without 0.25 mm diazoxide (Dz). C shows the differences in insulin release between 1 and 10 mm glucose from data shown in B. Means ± S.E. are of 9–15 separate determinations from 3 to 5 independent experiments. *, p < 0.05; ***, p < 0.001 versus scrambled ATGL for the same incubation condition; one way-ANOVA, Bonferroni post hoc test.
FIGURE 6.
FIGURE 6.
ATGL−/− mice are insulino-sensitive and glucose-normotolerant and have a defect in glucose- and arginine-stimulated insulin secretion in vivo. A hyperglycemic clamp was performed in overnight fasted male wild type (ATGL+/+) and ATGL KO (ATGL−/−) mice. A, glucose levels during the clamp. B, insulin levels during the clamp and C, in response to an arginine (Arg) bolus (1 mmol/kg). D, first phase insulin secretion in response to elevated glucose (Gluc) expressed as AUC from 0 to 15 min. E, second phase insulin secretion (AUC) from 15–45 min. F, M/I index of insulin sensitivity calculated by dividing the glucose infusion rate (M) during the last 30 min of the clamp by circulating insulin levels (I) during the same period. M/I index is expressed as μmol·kg−1·min−1 glucose infusion per pmol/liter insulin. G and H, glycemia (G) and insulinemia (H) during an IPGTT in overnight fasted male ATGL+/+ and ATGL−/− mice. Mean ± S.E. are of 9 and 5 animals per group for HGC and IPGTT, respectively. *, p < 0.05; **, p < 0.01; ***, p < 0.001 versus ATGL+/+ for the same time; two-way ANOVA, Bonferroni post hoc test for A–C and G and H, and unpaired two-tailed Student's t test for D–F.
FIGURE 7.
FIGURE 7.
Isolated islets from ATGL−/− mice show reduced insulin release in response to glucose, palmitate, and KCl. A, insulin secretion in islets isolated from overnight fasted male ATGL−/− or ATGL+/+ mice incubated for 1 h in KRBH with 0.5% d-BSA at 2.8, 8.3, or 16.7 mm glucose (G) in the presence or absence of 0.4 mm palmitate (Pal) and at 2.8 mm glucose plus 35 mm KCl. Cont, control. Insulin release was normalized for the total islet insulin content shown in C. B, protein content per islet, and D, insulin content corrected by the protein content per islet. Means ± S.E. are of 15–20 separate determinations from islets of 5 ATGL−/− and 10 ATGL+/+ mice in five separate experiments. *, p < 0.05; **, p < 0.01; ***, p < 0.001 versus ATGL+/+ for the same incubation condition; unpaired two-tailed Student's t test.
FIGURE 8.
FIGURE 8.
Metabolic correlates of islets from ATGL+/+ and ATGL−/− mice. A, TG content in islets isolated from overnight fasted male mice. Means ± S.E. are of 13–14 separate determinations from islets of 8 ATGL−/− and 11 ATGL+/+ mice. Glycerol release, an index of lipolysis, expressed per protein (B) or TG content (C). Means ± S.E. are of 18–20 separate determinations from islets of 9 ATGL−/− and 15 ATGL+/+ mice in four separate experiments. Islets were incubated in KRBH at 2.8 or 16.7 mm glucose (G) with [9,10-3H]palmitate to assess FA esterification into TG (D), DAG (E), and PL (F), and FA oxidation (G). Means ± S.E. are of 12–14 separate determinations from islets of four ATGL−/− and four ATGL+/+ mice in three different experiments for FA oxidation, and means ± S.E. are of 19–20 separate determinations from islets of 10 ATGL−/− and 16 ATGL+/+ mice in five different experiments for FA esterification. Glucose utilization (H) and oxidation (I) were measured in islets incubated in KRBH at 2.8 or 16.7 mm glucose (G) with d-[U-14C]glucose and d-[5-3H]glucose. Means ± S.E. are of 27–31 separate determinations from islets of six ATGL−/− and six ATGL+/+ mice in three different experiments. **, p < 0.01; ***, p < 0.001 versus ATGL+/+ for the same incubation condition; unpaired two-tailed Student's t test.

Similar articles

Cited by

References

    1. Stein D. T., Esser V., Stevenson B. E., Lane K. E., Whiteside J. H., Daniels M. B., Chen S., McGarry J. D. ( 1996) J. Clin. Invest. 97, 2728– 2735 - PMC - PubMed
    1. Stein D. T., Stevenson B. E., Chester M. W., Basit M., Daniels M. B., Turley S. D., McGarry J. D. ( 1997) J. Clin. Invest. 100, 398– 403 - PMC - PubMed
    1. Nolan C. J., Madiraju M. S., Delghingaro-Augusto V., Peyot M. L., Prentki M. ( 2006) Diabetes 55, Suppl. 2, S16– 23 - PubMed
    1. Poitout V., Hagman D., Stein R., Artner I., Robertson R. P., Harmon J. S. ( 2006) J. Nutr. 136, 873– 876 - PMC - PubMed
    1. Prentki M., Joly E., El-Assaad W., Roduit R. ( 2002) Diabetes 51, Suppl. 3, S405– 413 - PubMed

Publication types

MeSH terms