Comparative Study
. 2009 Jul;155(Pt 7):2342-2352.
doi: 10.1099/mic.0.027417-0. Epub 2009 Apr 23.

Expression of the sarA family of genes in different strains of Staphylococcus aureus

Affiliations
Comparative Study

Expression of the sarA family of genes in different strains of Staphylococcus aureus

Anand Ballal et al. Microbiology (Reading). 2009 Jul.

Abstract

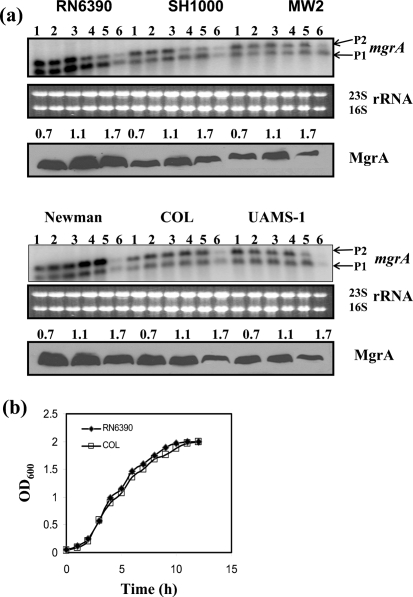
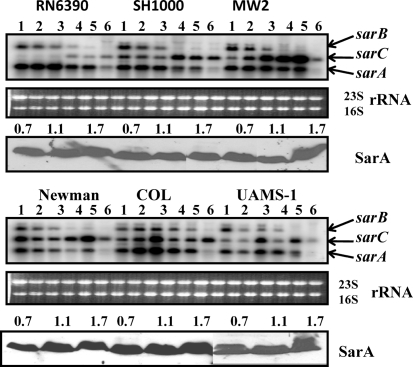
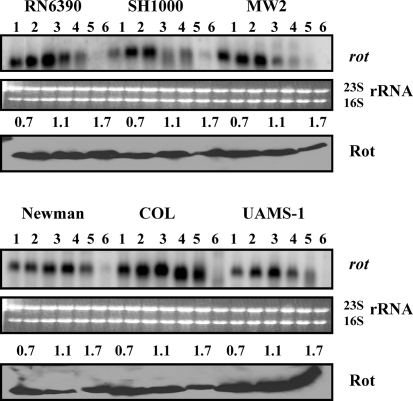
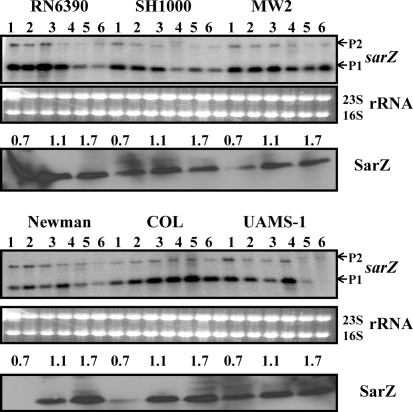
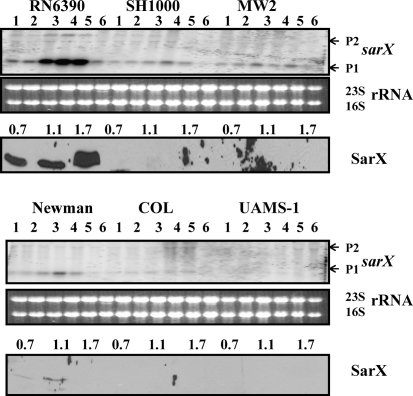
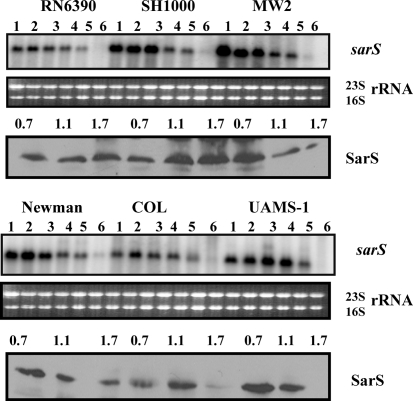
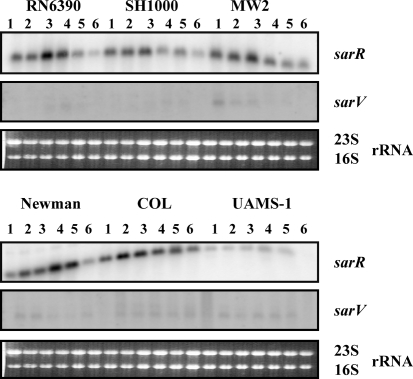
Expression of genes involved in the pathogenesis of Staphylococcus aureus is controlled by global regulatory loci, including two-component regulatory systems and transcriptional regulators. The staphylococcal-specific SarA family of transcription regulators control large numbers of target genes involved in virulence, autolysis, biofilm formation, stress responses and metabolic processes, and are recognized as potential therapeutic targets. Expression of some of these important regulators has been examined, mostly in laboratory strains, while the pattern of expression of these genes in other strains, especially clinical isolates, is largely unknown. In this report, a comparative analysis of 10 sarA-family genes was conducted in six different S. aureus strains, including two laboratory (RN6390, SH1000) and four clinical (MW2, Newman, COL and UAMS-1) strains, by Northern and Western blot analyses. Transcription of most of the sarA-family genes showed a strong growth phase-dependence in all strains tested. Among these genes, no difference was observed in expression of the sarA, sarV, sarT and sarU genes, while a major difference was observed in expression of the sarX gene only in strain RN6390. Expression of mgrA, rot, sarZ, sarR and sarS was observed in all strains, but the level of expression varied from strain to strain.


Figures

Fig. 1.
Fig. 1.
Expression of the mgrA gene in the different wild-type strains at the various phases of growth. (a) Northern blots were hybridized with 565 bp DNA fragments containing the coding region of the mgrA gene. A total of 10 μg RNA was loaded in each lane. Lanes 1–6, total cellular RNA from the growing cultures at OD600 0.3, 0.7, 1.1, 1.4, 1.7 and overnight (stationary) (Manna & Ray, 2007). P1 (0.56 knt) and P2 (0.75 knt) indicate the two transcripts of the mgrA locus (Ingavale et al., 2003). The region containing the 23S and 16S rRNA of the ethidium bromide-stained gel used for blotting is shown as a loading control. The third and sixth panels from the top represent the Western blot analyses for MgrA with anti-MgrA antibody in the different wild-type strains. Equivalent amounts of extracts (20 μg) from the different phases of growth (OD600 ∼0.7, early exponential; OD600 ∼1.1, exponential; OD600 ∼1.7, post-exponential) were used to detect MgrA expression. (b) Growth curves for the wild-type RN6390 and COL strains. There was no noticeable difference in growth of other strains. The OD600 of various cultures was measured in a Spectronic 20D spectrophotometer.
Fig. 2.
Fig. 2.
Expression of the sarA gene in the different wild-type strains at various phases of growth. Northern blots were hybridized with 450 bp DNA fragments containing the coding region of the sarA gene. A total of 10 μg cellular RNA was loaded in each lane. Lanes 1–6, total cellular RNA from the growing cultures at OD600 0.3, 0.7, 1.1, 1.4, 1.7 and overnight (stationary) (Fig. 1b). The sarB (1.15 knt), sarC (0.8 knt) and sarA (0.56 knt) transcripts originated from the P2, P3 and P1 promoters of the sarA locus (Bayer et al., 1996). The region containing the 23S and 16S rRNA of the ethidium bromide-stained gel used for blotting is shown as a loading control. The third and sixth panels from the top represent Western blots of intracellular extracts from the different wild-type strains probed with anti-SarA polyclonal antibodies. Equivalent amounts of extracts (20 μg) from the different phases of growth (OD600 ∼0.7, early exponential; OD600 ∼1.1, exponential; OD600 ∼1.7, post-exponential) were used to detect SarA expression.
Fig. 3.
Fig. 3.
Analysis of rot gene expression in the different wild-type strains at various phases of growth. Northern blots were hybridized with 450 bp DNA fragments containing the coding region of the rot gene to detect the ∼0.6 knt rot transcript. Lanes 1–6, 10 μg cellular RNA per lane from the growing cultures at OD600 0.3, 0.7, 1.1, 1.4, 1.7 and overnight (stationary) (Fig. 1b). The region containing the 23S and 16S rRNA of the ethidium bromide-stained gel used for blotting is shown as a loading control. The third and sixth panels from the top represent Western blots of intracellular extracts from the different wild-type strains probed with anti-Rot polyclonal antibodies. Equivalent amounts of extracts (20 μg) from the different phases of growth (OD600 ∼0.7, early exponential; OD600 ∼1.1, exponential; OD600 ∼1.7, post-exponential) were used to detect Rot expression.
Fig. 4.
Fig. 4.
Expression of the sarZ gene in the different wild-type strains at various phases of growth. Northern blots were hybridized with 550 bp DNA fragments containing the coding region of the sarZ gene. A total of 10 μg cellular RNA was loaded in each lane. Lanes 1–6, total cellular RNA from the growing cultures at OD600 0.3, 0.7, 1.1, 1.4, 1.7 and overnight (stationary) (Fig. 1b). P1 and P2 indicate the major (0.55 knt) and minor (1.5 knt) transcripts of the sarZ locus (Ballal et al., 2009). The region containing the 23S and 16S rRNA of the ethidium bromide-stained gel used for blotting is shown as a loading control. The third and sixth panels from the top represent Western blots of intracellular extracts from the different wild-type strains probed with anti-SarZ polyclonal antibodies. Equivalent amounts of extracts (20 μg) from the different phases of growth (OD600 ∼0.7, early exponential; OD600 ∼1.1, exponential; OD600 ∼1.7, post-exponential) were used to detect SarZ expression.
Fig. 5.
Fig. 5.
Expression of the sarX gene in the different wild-type strains at various phases of growth. Northern blots were hybridized with 550 bp DNA fragments containing the coding region of the sarX gene. A total of 10 μg cellular RNA was loaded in each lane. Lanes 1–6, total cellular RNA from the growing cultures at OD600 0.3, 0.7, 1.1, 1.4, 1.7 and overnight (stationary) (Fig. 1b). P1 and P2 indicate the major (0.5 knt) and minor (1.5 knt) transcripts of the sarX locus (Manna & Cheung, 2006a). The region containing 23S and 16S rRNA of the ethidium bromide-stained gel used for blotting is shown as a loading control. The third and sixth panels from the top represent Western blots of intracellular extracts from the different wild-type strains probed with anti-SarX polyclonal antibodies. Equivalent amounts of extracts (20 μg) from the different phases of growth (OD600 ∼0.7, early exponential; OD600 ∼1.1, exponential; OD600 ∼1.7, post-exponential) were used to detect SarX expression.
Fig. 6.
Fig. 6.
Analysis of expression of the sarS gene in the different wild-type strains at various phases of growth. Northern blots were hybridized with 800 bp DNA fragments containing the coding region of the sarS gene to detect the 0.95 knt sarS major transcript. Lanes 1–6, 10 μg cellular RNA per lane from the growing cultures at OD600 0.3, 0.7, 1.1, 1.4, 1.7 and overnight (stationary) (Fig. 1b). The region containing the 23S and 16S rRNA of the ethidium bromide-stained gel used for blotting is shown as a loading control. The third and sixth panels from the top represent Western blots of intracellular extracts from the different wild-type strains probed with anti-SarS polyclonal antibodies. Equivalent amounts of extracts (20 μg) from the different phases of growth (OD600 ∼0.7, early exponential; OD600 ∼1.1, exponential; OD600 ∼1.7, post-exponential) were used to detect SarS expression.
Fig. 7.
Fig. 7.
Northern blot analysis of the sarR (0.5 knt) and sarV (0.5 knt) transcripts in the different wild-type S. aureus strains. Blots were probed with 400 bp sarR and 360 bp sarV fragments containing the entire coding region of the sarR and sarV genes. A total of 10 μg cellular RNA was loaded into each lane. Lanes 1–6, total cellular RNA from the growing cultures at OD600 0.3, 0.7, 1.1, 1.4, 1.7 and overnight (stationary) (Fig. 1b). The region containing the 23S and 16S rRNA of the ethidium bromide-stained gel used for blotting is shown as a loading control.

Similar articles

Cited by

References

    1. Alekshun, M. N., Levy, S. B., Mealy, T. R., Seaton, B. A. & Head, J. F. (2001). The crystal structure of MarR, a regulator of multiple antibiotic resistance, at 2.3 Å resolution. Nat Struct Biol 8, 710–714. - PubMed
    1. Baba, T., Takeuchi, F., Kuroda, M., Yuzawa, H., Aoki, K., Oguchi, A., Nagal, Y., Iwama, N., Asano, K. & other authors (2002). Genome and virulence determinants of high virulence community-acquired MRSA. Lancet 359, 1819–1827. - PubMed
    1. Bae, T., Banger, A. K., Wallace, A., Glass, E. M., Aslund, F., Schneewind, O. & Missiakas, D. M. (2004). Staphylococcus aureus virulence genes identified by bursa aurealis mutagenesis and nematode killing. Proc Natl Acad Sci U S A 101, 12312–12317. - PMC - PubMed
    1. Ballal, A., Ray, B. & Manna, A. C. (2009). sarZ, a sarA family gene, is transcriptionally activated by MgrA and is involved in the regulation of genes encoding exoproteins in Staphylococcus aureus. J Bacteriol 191, 1656–1665. - PMC - PubMed
    1. Bayer, M. G., Heinrichs, J. H. & Cheung, A. L. (1996). The molecular architecture of the sar locus in Staphylococcus aureus. J Bacteriol 178, 4563–4570. - PMC - PubMed

Publication types

MeSH terms