

Portal pressure responses and angiotensin peptide production in rat liver are determined by relative activity of ACE and ACE2
- PMID: 19389807
- PMCID: PMC2711749
- DOI: 10.1152/ajpgi.00045.2009
Portal pressure responses and angiotensin peptide production in rat liver are determined by relative activity of ACE and ACE2
Abstract
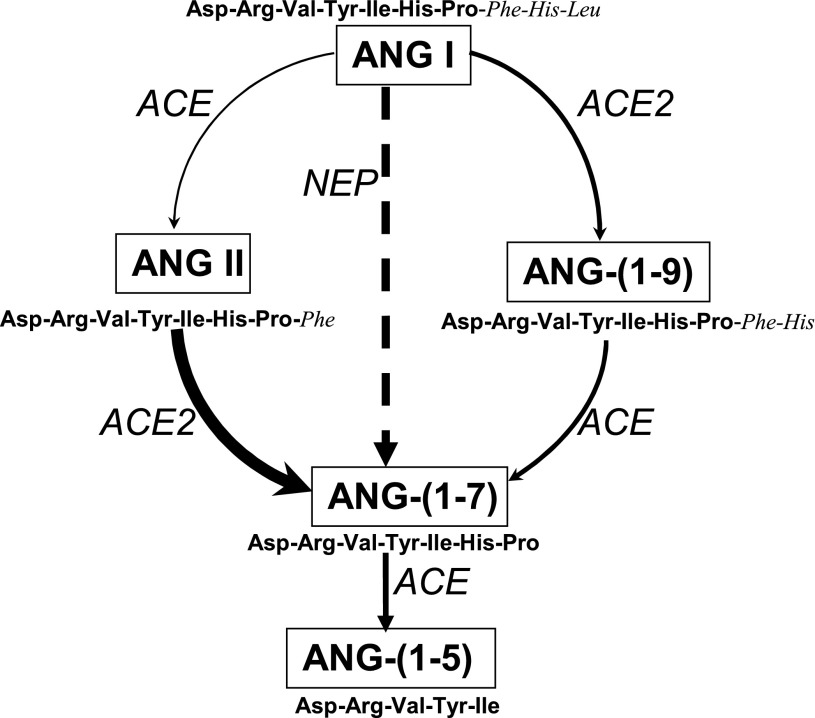
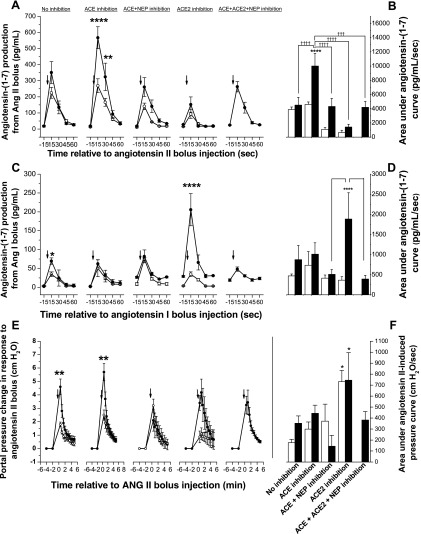
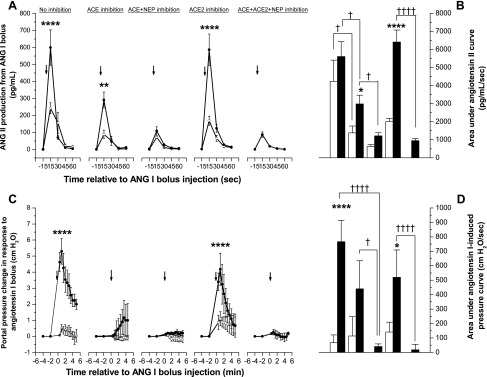
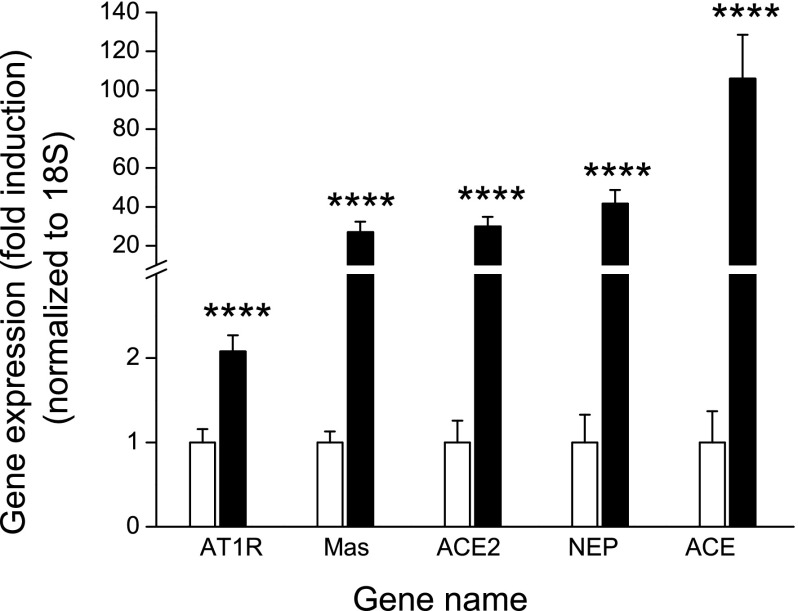
Angiotensin converting enzyme (ACE) 2 activity and angiotensin-(1-7) [Ang-(1-7)] levels are increased in experimental cirrhosis; however, the pathways of hepatic Ang-(1-7) production have not been studied. This study investigated the role of ACE2, ACE, and neutral endopeptidase (NEP) in the hepatic formation of Ang-(1-7) from angiotensin I (Ang I) and Ang II and their effects on portal resistance. Ang I or Ang II were administered to rat bile duct ligated (BDL) and control livers alone and in combination with the ACE inhibitor lisinopril, the ACE and NEP inhibitor omapatrilat, or the ACE2 inhibitor MLN4760 (n = 5 per group). BDL markedly upregulated ACE, ACE2, and NEP. Ang-(1-7) was produced from Ang II in healthy and in BDL livers and was increased following ACE inhibition and decreased by ACE2 inhibition. In contrast, Ang-(1-7) production from Ang I was minimal and not affected by ACE or NEP inhibition. Surprisingly, ACE2 inhibition in BDLs dramatically increased Ang-(1-7) production from Ang I, an effect abolished by ACE2/NEP inhibition. Ang II and Ang I induced greater portal pressure increases in BDL livers than controls. The effects of Ang I were closely correlated with Ang II production and were strongly attenuated by both ACE and ACE/NEP inhibition. These findings show that the major substrate for hepatic production of Ang-(1-7) is Ang II and this is catalyzed by ACE2. Ang I is largely converted to Ang II by ACE, and net conversion of Ang I to Ang-(1-7) is small. NEP has the ability to generate large amounts of Ang-(1-7) in the BDL liver from Ang I only when ACE2 activity is greatly decreased or inhibited.
Figures

Similar articles
-
New Viral Diseases and New Possible Remedies by Means of the Pharmacology of the Renin-Angiotensin System.J Renin Angiotensin Aldosterone Syst. 2023 Jul 12;2023:3362391. doi: 10.1155/2023/3362391. eCollection 2023. J Renin Angiotensin Aldosterone Syst. 2023. PMID: 37476705 Free PMC article. Review.
-
Evaluation of angiotensin-converting enzyme (ACE), its homologue ACE2 and neprilysin in angiotensin peptide metabolism.Biochem J. 2004 Oct 1;383(Pt 1):45-51. doi: 10.1042/BJ20040634. Biochem J. 2004. PMID: 15283675 Free PMC article.
-
Upregulation of hepatic angiotensin-converting enzyme 2 (ACE2) and angiotensin-(1-7) levels in experimental biliary fibrosis.J Hepatol. 2007 Sep;47(3):387-95. doi: 10.1016/j.jhep.2007.03.008. Epub 2007 Apr 2. J Hepatol. 2007. PMID: 17532087 Free PMC article.
-
Angiotensin I-converting enzyme-dependent and neutral endopeptidase-dependent generation and degradation of angiotensin II contrarily modulate noradrenaline release: implications for vasopeptidase-inhibitor therapy?J Hypertens. 2005 Aug;23(8):1597-604. doi: 10.1097/01.hjh.0000173395.42794.cd. J Hypertens. 2005. PMID: 16003188
-
Liver disease and the renin-angiotensin system: recent discoveries and clinical implications.J Gastroenterol Hepatol. 2008 Sep;23(9):1327-38. doi: 10.1111/j.1440-1746.2008.05461.x. Epub 2008 Jun 28. J Gastroenterol Hepatol. 2008. PMID: 18557800 Free PMC article. Review.
Cited by
-
Update on New Aspects of the Renin-Angiotensin System in Hepatic Fibrosis and Portal Hypertension: Implications for Novel Therapeutic Options.J Clin Med. 2021 Feb 11;10(4):702. doi: 10.3390/jcm10040702. J Clin Med. 2021. PMID: 33670126 Free PMC article. Review.
-
Angiotensin-converting enzyme 2 receptors, chronic liver diseases, common medications, and clinical outcomes in coronavirus disease 2019 patients.World J Virol. 2021 May 25;10(3):86-96. doi: 10.5501/wjv.v10.i3.86. World J Virol. 2021. PMID: 34079691 Free PMC article. Review.
-
Not just angiotensinases: new roles for the angiotensin-converting enzymes.Cell Mol Life Sci. 2010 Jan;67(1):89-98. doi: 10.1007/s00018-009-0152-x. Epub 2009 Sep 10. Cell Mol Life Sci. 2010. PMID: 19763395 Free PMC article. Review.
-
New Viral Diseases and New Possible Remedies by Means of the Pharmacology of the Renin-Angiotensin System.J Renin Angiotensin Aldosterone Syst. 2023 Jul 12;2023:3362391. doi: 10.1155/2023/3362391. eCollection 2023. J Renin Angiotensin Aldosterone Syst. 2023. PMID: 37476705 Free PMC article. Review.
-
Molecular dissection of the role of ACE2 in glucose homeostasis.Physiol Rev. 2025 Jul 1;105(3):935-973. doi: 10.1152/physrev.00027.2024. Epub 2025 Feb 7. Physiol Rev. 2025. PMID: 39918873 Free PMC article. Review.
References
-
- Ballet F, Chretien Y, Rey C, Poupon R. Differential response of normal and cirrhotic liver to vasoactive agents. A study in the isolated perfused rat liver. J Pharmacol Exp Ther 244: 283–289, 1988. - PubMed
-
- Bataller R, Gabele E, Schoonhoven R, Morris T, Lehnert M, Yang L, Brenner DA, Rippe RA. Prolonged infusion of angiotensin II into normal rats induces stellate cell activation and proinflammatory events in liver. Am J Physiol Gastrointest Liver Physiol 285: G642–G651, 2003. - PubMed
-
- Benter IF, Yousif MH, Anim JT, Cojocel C, Diz DI. Angiotensin-(1-7) prevents development of severe hypertension and end-organ damage in spontaneously hypertensive rats treated with l-NAME. Am J Physiol Heart Circ Physiol 290: H684–H691, 2006. - PubMed
-
- Burchill L, Velkoska E, Dean RG, Lew RA, Smith AI, Levidiotis V, Burrell LM. Acute kidney injury in the rat causes cardiac remodelling and increases angiotensin-converting enzyme 2 expression. Exp Physiol 93: 622–630, 2008. - PubMed
Publication types
MeSH terms
Substances
LinkOut - more resources
Full Text Sources
Miscellaneous