

Fasting-induced hepatic production of DHEA is regulated by PGC-1alpha, ERRalpha, and HNF4alpha
- PMID: 19389810
- PMCID: PMC2718748
- DOI: 10.1210/me.2009-0024
Fasting-induced hepatic production of DHEA is regulated by PGC-1alpha, ERRalpha, and HNF4alpha
Abstract
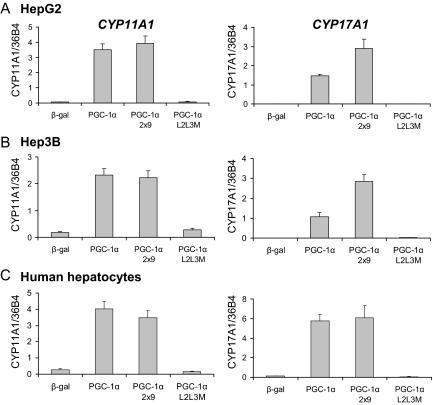
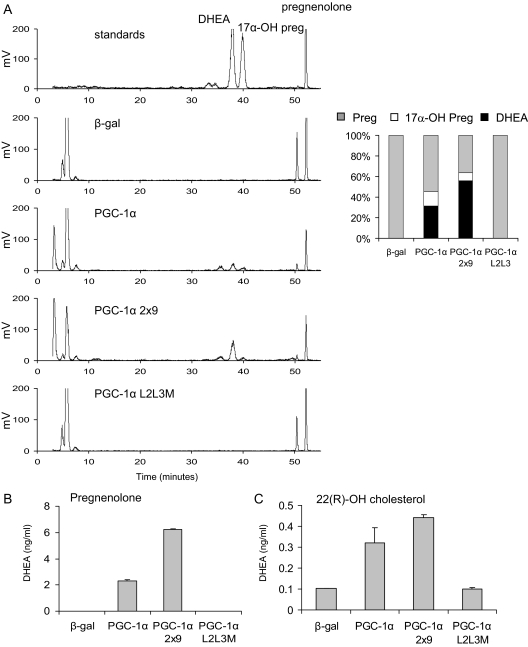
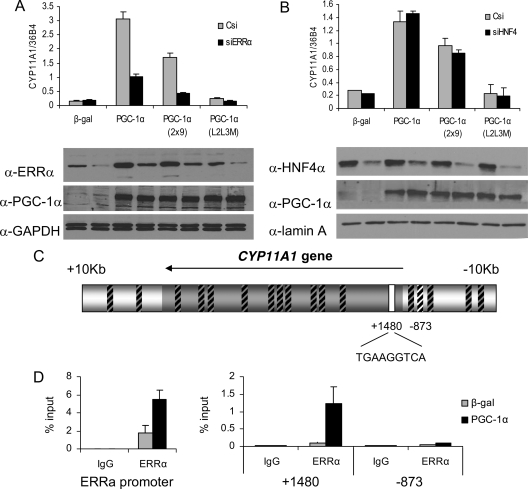
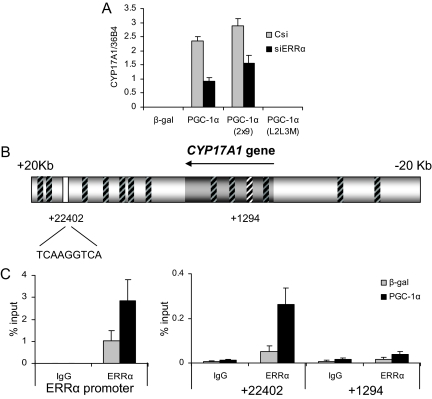
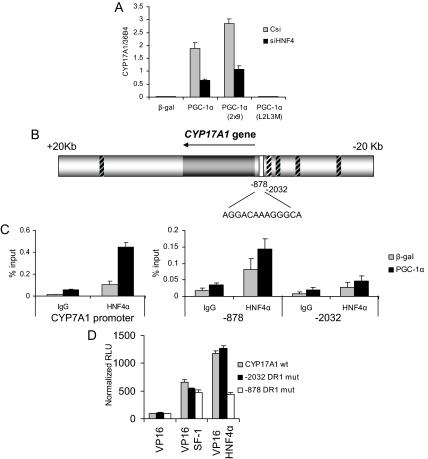
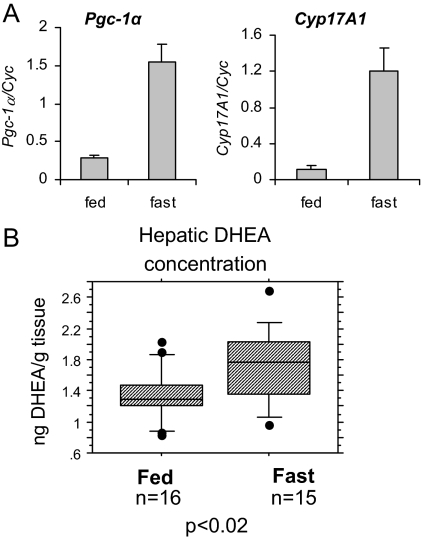
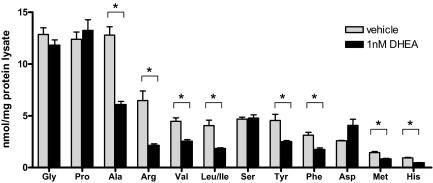
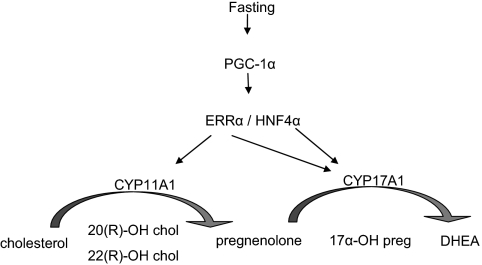
The transcriptional coactivator peroxisome proliferator-activated receptor-gamma coactivator (PGC)-1alpha is involved in the coordinate induction of changes in gene expression in the liver that enable a homeostatic response to alterations in metabolic state, environmental cues, and nutrient availability. In exploring the specific pathways under PGC-1alpha regulation in the liver, we have made the surprising observation that this coactivator can induce the expression of CYP11A1 and CYP17A1, key rate-limiting enzymes involved in the initial steps of steroidogenesis. Both of these enzymes function to produce C(19)-steroids, converting cholesterol into pregnenolone, and then to dehydroepiandrosterone (DHEA). Estrogen-related receptor (ERR)-alpha mediates PGC-1alpha's induction of CYP11A1 and binds within the first intron of the CYP11A1 gene. Both ERR-alpha and hepatocyte nuclear factor-4alpha are required for PGC-1alpha-mediated induction of CYP17A1, and specific binding sites for these receptors have been identified in the regulatory regions of this gene. The potential physiological significance of these observations was highlighted in rats where fasting induced hepatic expression of PGC-1alpha and CYP17A1 and was associated with an increase in hepatic levels of DHEA. These data suggest that DHEA could be playing a role as an intracellular signaling molecule involved in modulating hepatic activity in response to fasting conditions.
Figures
Similar articles
-
Regulation of constitutive androstane receptor and its target genes by fasting, cAMP, hepatocyte nuclear factor alpha, and the coactivator peroxisome proliferator-activated receptor gamma coactivator-1alpha.J Biol Chem. 2006 Sep 8;281(36):26540-51. doi: 10.1074/jbc.M600931200. Epub 2006 Jul 5. J Biol Chem. 2006. PMID: 16825189 Free PMC article.
-
Regulation of PPARgamma coactivator 1alpha (PGC-1alpha) signaling by an estrogen-related receptor alpha (ERRalpha) ligand.Proc Natl Acad Sci U S A. 2004 Jun 15;101(24):8912-7. doi: 10.1073/pnas.0401420101. Epub 2004 Jun 7. Proc Natl Acad Sci U S A. 2004. PMID: 15184675 Free PMC article.
-
Selenoprotein P expression is controlled through interaction of the coactivator PGC-1alpha with FoxO1a and hepatocyte nuclear factor 4alpha transcription factors.Hepatology. 2008 Dec;48(6):1998-2006. doi: 10.1002/hep.22526. Hepatology. 2008. PMID: 18972406
-
Tissue-specific regulation of metabolic pathways through the transcriptional coactivator PGC1-alpha.Int J Obes (Lond). 2005 Mar;29 Suppl 1:S5-9. doi: 10.1038/sj.ijo.0802905. Int J Obes (Lond). 2005. PMID: 15711583 Review.
-
Regulation of skeletal muscle cell plasticity by the peroxisome proliferator-activated receptor γ coactivator 1α.J Recept Signal Transduct Res. 2010 Dec;30(6):376-84. doi: 10.3109/10799891003641074. Epub 2010 Feb 24. J Recept Signal Transduct Res. 2010. PMID: 20178454 Review.
Cited by
-
ERRα as a Bridge Between Transcription and Function: Role in Liver Metabolism and Disease.Front Endocrinol (Lausanne). 2019 Apr 5;10:206. doi: 10.3389/fendo.2019.00206. eCollection 2019. Front Endocrinol (Lausanne). 2019. PMID: 31024446 Free PMC article. Review.
-
Transcriptional orchestration of mitochondrial homeostasis in a cellular model of PGC-1-related coactivator-dependent thyroid tumor.Oncotarget. 2018 Mar 23;9(22):15883-15894. doi: 10.18632/oncotarget.24633. eCollection 2018 Mar 23. Oncotarget. 2018. PMID: 29662614 Free PMC article.
-
The Utilization of Dehydroepiandrosterone as a Sexual Hormone Precursor in Premenopausal and Postmenopausal Women: An Overview.Pharmaceuticals (Basel). 2021 Dec 29;15(1):46. doi: 10.3390/ph15010046. Pharmaceuticals (Basel). 2021. PMID: 35056103 Free PMC article. Review.
-
RNA-seq analysis of differential gene expression in liver from lactating dairy cows divergent in negative energy balance.BMC Genomics. 2012 May 20;13:193. doi: 10.1186/1471-2164-13-193. BMC Genomics. 2012. PMID: 22607119 Free PMC article.
-
Metformin reduces hepatic expression of SIRT3, the mitochondrial deacetylase controlling energy metabolism.PLoS One. 2012;7(11):e49863. doi: 10.1371/journal.pone.0049863. Epub 2012 Nov 16. PLoS One. 2012. PMID: 23166782 Free PMC article.
References
-
- Muoio DM, Newgard CB 2006 Obesity-related derangements in metabolic regulation. Annu Rev Biochem 75:367–401 - PubMed
-
- Yoon JC, Puigserver P, Chen G, Donovan J, Wu Z, Rhee J, Adelmant G, Stafford J, Kahn CR, Granner DK, Newgard CB, Spiegelman BM 2001 Control of hepatic gluconeogenesis through the transcriptional coactivator PGC-1. Nature 413:131–138 - PubMed
-
- Herzig S, Long F, Jhala US, Hedrick S, Quinn R, Bauer A, Rudolph D, Schutz G, Yoon C, Puigserver P, Spiegelman B, Montminy M 2001 CREB regulates hepatic gluconeogenesis through the coactivator PGC-1. Nature 413:179–183 - PubMed
-
- Li X, Monks B, Ge Q, Birnbaum MJ 2007 Akt/PKB regulates hepatic metabolism by directly inhibiting PGC-1α transcription coactivator. Nature 447:1012–1016 - PubMed
Publication types
MeSH terms
Substances
Grants and funding
LinkOut - more resources
Full Text Sources
Molecular Biology Databases
