

Molecular correlates of renal function in kidney transplant biopsies
- PMID: 19389845
- PMCID: PMC2678047
- DOI: 10.1681/ASN.2008080863
Molecular correlates of renal function in kidney transplant biopsies
Abstract
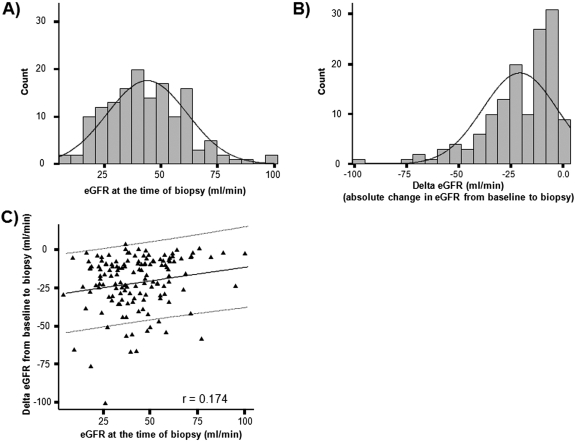
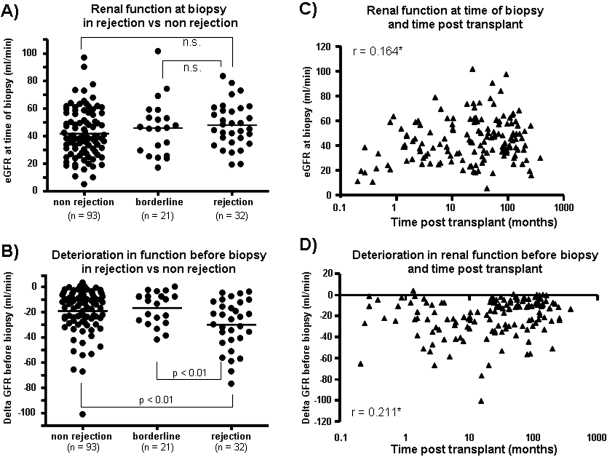
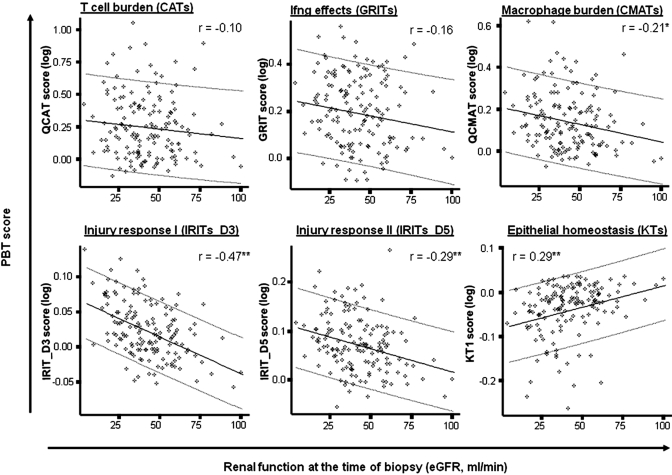
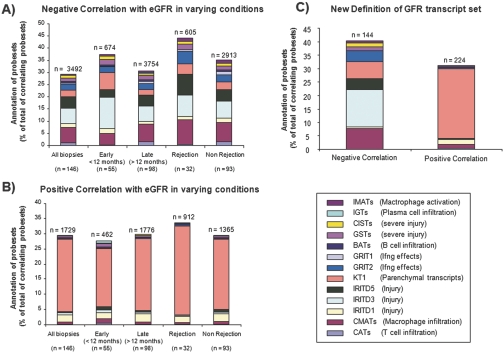
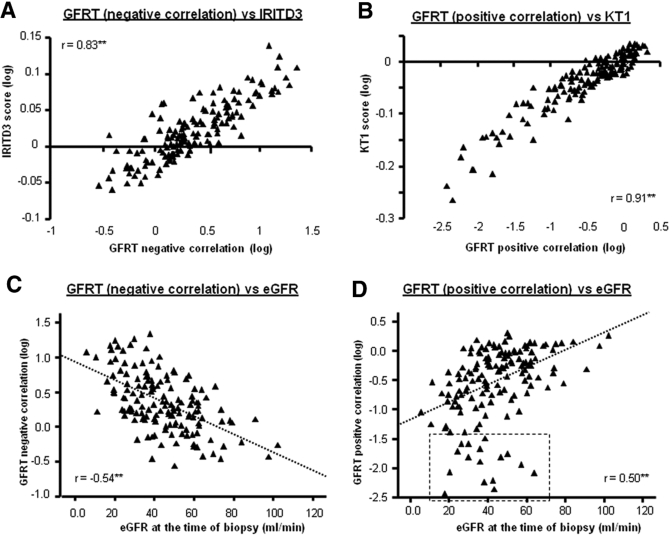
The molecular changes in the parenchyma that reflect disturbances in the function of kidney transplants are unknown. We studied the relationships among histopathology, gene expression, and renal function in 146 human kidney transplant biopsies performed for clinical indications. Impaired function (estimated GFR) correlated with tubular atrophy and fibrosis but not with inflammation or rejection. Functional deterioration before biopsy correlated with inflammation and tubulitis and was greater in cases of rejection. Microarray analysis revealed a correlation between impaired renal function and altered expression of sets of transcripts consistent with tissue injury but not with those consistent with cytotoxic T cell infiltration or IFN-gamma effects. Multivariate analysis of clinical variables, histologic lesions, and transcript sets confirmed that expression of injury-related transcript sets independently correlated with renal function. Analysis of individual genes confirmed that the transcripts with the greatest positive or negative correlations with renal function were those suggestive of response to injury and parenchymal dedifferentiation not inflammation. We defined new sets of genes based on individual transcripts that correlated with renal function, and these highly correlated with the previously developed injury sets and with atrophy and fibrosis. Thus, in biopsies performed for clinical reasons, functional disturbances are reflected in transcriptome changes representing tissue injury and dedifferentiation but not the inflammatory burden.
Figures
Similar articles
-
Utility of Serial Protocol Biopsies Performed After 1 Year in Predicting Long-Term Kidney Allograft Function According to Histologic Phenotype.Exp Clin Transplant. 2018 Aug;16(4):391-400. doi: 10.6002/ect.2016.0323. Epub 2017 Dec 5. Exp Clin Transplant. 2018. PMID: 29206090
-
The molecular phenotype of 6-week protocol biopsies from human renal allografts: reflections of prior injury but not future course.Am J Transplant. 2011 Apr;11(4):708-18. doi: 10.1111/j.1600-6143.2010.03339.x. Epub 2010 Nov 29. Am J Transplant. 2011. PMID: 21114657
-
Microarray analysis of rejection in human kidney transplants using pathogenesis-based transcript sets.Am J Transplant. 2007 Dec;7(12):2712-22. doi: 10.1111/j.1600-6143.2007.02005.x. Epub 2007 Oct 17. Am J Transplant. 2007. PMID: 17941957
-
The Molecular Microscope Diagnostic System: Assessment of Rejection and Injury in Heart Transplant Biopsies.Transplantation. 2023 Jan 1;107(1):27-44. doi: 10.1097/TP.0000000000004323. Epub 2022 Dec 8. Transplantation. 2023. PMID: 36508644 Review.
-
Antibody-mediated rejection, T cell-mediated rejection, and the injury-repair response: new insights from the Genome Canada studies of kidney transplant biopsies.Kidney Int. 2014 Feb;85(2):258-64. doi: 10.1038/ki.2013.300. Epub 2013 Aug 21. Kidney Int. 2014. PMID: 23965521 Review.
Cited by
-
Computational identification of novel signature of T2DM-induced nephropathy and therapeutic bioactive compounds from Azanza garckeana.Am J Transl Res. 2023 Jul 15;15(7):4504-4520. eCollection 2023. Am J Transl Res. 2023. PMID: 37560206 Free PMC article.
-
Recent advances in renal interstitial fibrosis and tubular atrophy after kidney transplantation.Fibrogenesis Tissue Repair. 2014 Oct 2;7:15. doi: 10.1186/1755-1536-7-15. eCollection 2014. Fibrogenesis Tissue Repair. 2014. PMID: 25285155 Free PMC article. Review.
-
Phosphoinositide binding differentially regulates NHE1 Na+/H+ exchanger-dependent proximal tubule cell survival.J Biol Chem. 2011 Dec 9;286(49):42435-42445. doi: 10.1074/jbc.M110.212845. Epub 2011 Oct 21. J Biol Chem. 2011. PMID: 22020933 Free PMC article.
-
A randomized 2×2 factorial trial, part 1: single-dose rabbit antithymocyte globulin induction may improve renal transplantation outcomes.Transplantation. 2015 Jan;99(1):197-209. doi: 10.1097/TP.0000000000000250. Transplantation. 2015. PMID: 25083614 Free PMC article. Clinical Trial.
-
Plasma Vitamin C and Type 2 Diabetes: Genome-Wide Association Study and Mendelian Randomization Analysis in European Populations.Diabetes Care. 2021 Jan;44(1):98-106. doi: 10.2337/dc20-1328. Epub 2020 Nov 17. Diabetes Care. 2021. PMID: 33203707 Free PMC article.
References
-
- Suri D, Meyer TW: Influence of donor factors on early function of graft kidneys. J Am Soc Nephrol 10: 1317–1323, 1999 - PubMed
-
- Keith DS, DeMattos A, Golconda M, Prather J, Cantarovich M, Paraskevas S, Tchervenkov J, Norman DJ: Factors associated with improvement in deceased donor renal allograft function in the 1990s. J Am Soc Nephrol 16: 1512–1521, 2005 - PubMed
-
- Agodoa L, Eknoyan G, Ingelfinger J, Keane W, Mauer M, Mitch W, Striker G, Wilcox C: Assessment of structure and function in progressive renal disease. Kidney Int 52: S144–S150, 1997 - PubMed
-
- Bohle A, Grund KE, Mackensen S, Tolon M: Correlations between renal interstitium and level of serum creatinine. Morphometric investigations of biopsies in perimembranous glomerulonephritis. Virchows Arch A Pathol Anat Histol 373: 15–22, 1977 - PubMed
-
- Bohle A, Christ H, Grund KE, Mackensen S: The role of the interstitium of the renal cortex in renal disease. Contrib Nephrol 16: 109–114, 1979 - PubMed
Publication types
MeSH terms
Substances
LinkOut - more resources
Full Text Sources
Medical
