Fetuin-A protects against atherosclerotic calcification in CKD
- PMID: 19389852
- PMCID: PMC2689898
- DOI: 10.1681/ASN.2008060572
Fetuin-A protects against atherosclerotic calcification in CKD
Abstract
Reduced serum levels of the calcification inhibitor fetuin-A associate with increased cardiovascular mortality in dialysis patients. Fetuin-A-deficient mice display calcification of various tissues but notably not of the vasculature. This absence of vascular calcification may result from the protection of an intact endothelium, which becomes severely compromised in the setting of atherosclerosis. To test this hypothesis, we generated fetuin-A/apolipoprotein E (ApoE)-deficient mice and compared them with ApoE-deficient and wild-type mice with regard to atheroma formation and extraosseous calcification. We assigned mice to three treatment groups for 9 wk: (1) Standard diet, (2) high-phosphate diet, or (3) unilateral nephrectomy (causing chronic kidney disease [CKD]) plus high-phosphate diet. Serum urea, phosphate, and parathyroid hormone levels were similar in all genotypes after the interventions. Fetuin-A deficiency did not affect the extent of aortic lipid deposition, neointima formation, and coronary sclerosis observed with ApoE deficiency, but the combination of fetuin-A deficiency, hyperphosphatemia, and CKD led to a 15-fold increase in vascular calcification in this model of atherosclerosis. Fetuin-A deficiency almost exclusively promoted intimal rather than medial calcification of atheromatous lesions. High-phosphate diet and CKD also led to an increase in valvular calcification and aorta-associated apoptosis, with wild-type mice having the least, ApoE-deficient mice intermediate, and fetuin-A/ApoE-deficient mice the most. In addition, the combination of fetuin-A deficiency, high-phosphate diet, and CKD in ApoE-deficient mice greatly enhanced myocardial calcification, whereas the absence of fetuin-A did not affect the incidence of renal calcification. In conclusion, fetuin-A inhibits pathologic calcification in both the soft tissue and vasculature, even in the setting of atherosclerosis.
Figures

 ), and Ahsg−/−/ApoE−/− (□) mice. The columns represent means ± SD. *P < 0.05 versus group 1; aP < 0.05 between low phosphorus (LP) and matched HP group (1 versus 2; 4 versus 5; 7 versus 8); bP < 0.05 between CKD and matched control group (1 versus 3; 4 versus 6; 7 versus 9). Numbers of mice reaching the end of the study as well as total animal numbers (in parentheses) of every group are given.
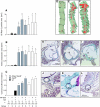
 ), and Ahsg−/−/ApoE−/− (□) mice and representative photomicrographs of en face–mounted Oil Red O–stained aortas or stained tissue sections. (A) Atherosclerotic lesion size estimated from Oil Red O–stained whole-mount aortas as depicted on the right for experimental groups 3, 6, and 9 (D, E, and F). (B) Intima thickness (int) determined from serial sections cut through the aortic root displaying the aortic sinus and the aortic valve leaflets (lft) after Masson’s trichrome staining as depicted on the right for experimental groups 3, 6, and 9 (G, H, and I). (C) Incidence of coronary sclerosis. Representative sections of the experimental groups 3, 6, and 9 (J, K, and L) after Masson’s trichrome staining depict proximal coronary arteries (circles). All values in groups 4 through 9 differed significantly from the matching values in groups 1 through 3 (P < 0.05). Numbers of mice reaching the end of the study as well as total animal numbers (in parentheses) of every group are given.
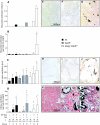
 ), and Ahsg−/−/ApoE−/− (□) mice. (D through I) Representative photomicrographs are depicted on the right for the treatment groups 3 (D and G), 6 (E and H), and 9 (F and I). (J) A type 5b calcified plaque stained with von Kossa. The tissue was not decalcified before sectioning and thus partially ruptured. (K) A similarly large calcified atherosclerotic lesion stained strongly positive with hematoxylin, suggesting proteinaceous calcified debris, and also AnnexinV (brown stain), indicating apoptosis close to the calcified border region of the plaque. (L) Apoptosis in the aorta wall was further analyzed by fluorescence terminal deoxynucleotidyl transferase–mediated digoxigenin-deoxyuridine nick-end labeling staining. Note that the elastic layer of the tunica media (white arrows) is autofluorescent. White broken lines encircle strongly positive nuclei of apoptotic cells in an extended atherosclerotic plaque (group 9). The columns in A through C represent means ± SD. *P < 0.05 versus group 1; aP < 0.05 between LP and matched HP group (1 versus 2; 4 versus 5; 7 versus 8); bP < 0.05 between CKD and matched control group (1 versus 3; 4 versus 6; 7 versus 9); cP < 0.05 between Ahsg−/−/ApoE−/− and matched ApoE−/− group (4 versus 7; 5 versus 8; 6 versus 9). Numbers of mice reaching the end of the study as well as total animal numbers (in parentheses) of every group are given.

 ), and Ahsg−/−/ApoE−/− (□) mice. (A and B) Myocardial calcification incidence and extent, respectively. (C) Aortic valve calcification. (D) Kidney calcification. (E through M) Representative photomicrographs are depicted on the right for the treatment groups 3 (E, H, and K), 6 (F, I, and L) and 9 (G, J, and M). The columns represent means ± SD. *P < 0.05 versus group 1; aP < 0.05 between LP and matched HP group (1 versus 2; 4 versus 5; 7 versus 8); bP < 0.05 between CKD and matched control group (1 versus 3; 4 versus 6; 7 versus 9); cP < 0.05 between Ahsg−/−/ApoE−/− and matched ApoE−/− group (4 versus 7; 5 versus 8; 6 versus 9). Numbers of mice reaching the end of the study as well as total animal numbers (in parentheses) of every group are given.
Comment in
-
Vascular calcification: the three-hit model.J Am Soc Nephrol. 2009 Jun;20(6):1162-4. doi: 10.1681/ASN.2009040409. Epub 2009 May 21. J Am Soc Nephrol. 2009. PMID: 19470670 No abstract available.
References
-
- Collins AJ, Li SL, Ma JZ, Herzog C: Cardiovascular disease in end-stage renal disease patients. Am J Kidney Dis 38: S26–S29, 2001 - PubMed
-
- Blacher J, Guerin AP, Pannier B, Marchais SJ, London GM: Arterial calcifications, arterial stiffness, and cardiovascular risk in end-stage renal disease. Hypertension 38: 938–942, 2001 - PubMed
-
- Ghadially FN: As you like it: Part 3—A critique and historical review of calcification as seen with the electron microscope. Ultrastruct Pathol 25: 243–267, 2001 - PubMed
Publication types
MeSH terms
Substances
LinkOut - more resources
Full Text Sources
Other Literature Sources
Medical
Miscellaneous

