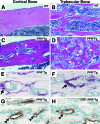
Osteoprotegerin abrogated cortical porosity and bone marrow fibrosis in a mouse model of constitutive activation of the PTH/PTHrP receptor
- PMID: 19389927
- PMCID: PMC2684181
- DOI: 10.2353/ajpath.2009.081026
Osteoprotegerin abrogated cortical porosity and bone marrow fibrosis in a mouse model of constitutive activation of the PTH/PTHrP receptor
Abstract
Intracortical porosities and marrow fibrosis are hallmarks of hyperparathyroidism and are present in bones of transgenic mice expressing constitutively active parathyroid hormone/parathyroid hormone-related protein receptors (PPR*Tg). Cortical porosity is the result of osteoclast activity; however, the etiology of marrow fibrosis is poorly understood. While osteoclast numbers and activity are regulated by osteoprotegerin (OPG), bisphosphonates suppress osteoclast activity but not osteoclast numbers. We therefore used OPG and bisphosphonates to evaluate the extent to which osteoclasts, as opposed to bone resorption, regulate marrow fibrosis in PPR*Tg mice after treatment of animals with vehicle, OPG, alendronate, or zoledronate. All three agents similarly increased trabecular bone volume in both PPR*Tg and control mice, suggesting that trabecular bone resorption was comparably suppressed by these agents. However, the number of trabecular osteoclasts was greatly decreased by OPG but not by either alendronate or zoledronate. Furthermore, intracortical porosity and marrow fibrosis were virtually abolished by OPG treatment, whereas alendronate and zoledronate only partially reduced these two parameters. The greater reductions in cortical porosity and increments in cortical bone mineral density with OPG in PPR*Tg mice were associated with greater improvements in bone strength. The differential effect of OPG versus bisphosphonates on marrow fibrosis, despite similar effects on trabecular bone volume, suggests that marrow fibrosis was related not only to bone resorption but also to the presence of osteoclasts.
Figures


Similar articles
-
Endogenous parathyroid hormone-related protein compensates for the absence of parathyroid hormone in promoting bone accrual in vivo in a model of bone marrow ablation.J Bone Miner Res. 2013 Sep;28(9):1898-911. doi: 10.1002/jbmr.2000. J Bone Miner Res. 2013. PMID: 23716486
-
Parathyroid hormone (PTH)/PTH-related peptide type 1 receptor (PPR) signaling in osteocytes regulates anabolic and catabolic skeletal responses to PTH.J Biol Chem. 2013 Jul 12;288(28):20122-34. doi: 10.1074/jbc.M112.441360. Epub 2013 Jun 2. J Biol Chem. 2013. PMID: 23729679 Free PMC article.
-
Disruption of PTH receptor 1 in T cells protects against PTH-induced bone loss.PLoS One. 2010 Aug 20;5(8):e12290. doi: 10.1371/journal.pone.0012290. PLoS One. 2010. PMID: 20808842 Free PMC article.
-
Preclinical studies with zoledronic acid and other bisphosphonates: impact on the bone microenvironment.Semin Oncol. 2001 Apr;28(2 Suppl 6):35-44. doi: 10.1016/s0093-7754(01)90263-5. Semin Oncol. 2001. PMID: 11346863 Review.
-
Osteoprotegerin: a physiological and pharmacological inhibitor of bone resorption.Curr Pharm Des. 2001 May;7(8):613-35. doi: 10.2174/1381612013397807. Curr Pharm Des. 2001. PMID: 11375772 Review.
Cited by
-
Osteoclasts: more than 'bone eaters'.Trends Mol Med. 2014 Aug;20(8):449-59. doi: 10.1016/j.molmed.2014.06.001. Epub 2014 Jul 6. Trends Mol Med. 2014. PMID: 25008556 Free PMC article. Review.
-
Are osteoclasts needed for the bone anabolic response to parathyroid hormone? A study of intermittent parathyroid hormone with denosumab or alendronate in knock-in mice expressing humanized RANKL.J Biol Chem. 2010 Sep 3;285(36):28164-73. doi: 10.1074/jbc.M110.101964. Epub 2010 Jun 17. J Biol Chem. 2010. PMID: 20558734 Free PMC article.
-
Osteoblastic expansion induced by parathyroid hormone receptor signaling in murine osteocytes is not sufficient to increase hematopoietic stem cells.Blood. 2012 Mar 15;119(11):2489-99. doi: 10.1182/blood-2011-06-360933. Epub 2012 Jan 18. Blood. 2012. PMID: 22262765 Free PMC article.
-
PTH and stem cells.J Endocrinol Invest. 2011 Jul-Aug;34(7):552-6. doi: 10.3275/7620. Epub 2011 Mar 22. J Endocrinol Invest. 2011. PMID: 21427529 Review.
-
Acute development of cortical porosity and endosteal naïve bone formation from the daily but not weekly short-term administration of PTH in rabbit.PLoS One. 2017 Apr 10;12(4):e0175329. doi: 10.1371/journal.pone.0175329. eCollection 2017. PLoS One. 2017. PMID: 28394900 Free PMC article.
References
-
- Rodan GA, Martin TJ. Therapeutic approaches to bone diseases. Science. 2000;289:1508–1514. - PubMed
-
- Tolar J, Teitelbaum SL, Orchard PJ. Osteopetrosis. N Engl J Med. 2004;351:2839–2849. - PubMed
-
- Wang JC, Hemavathy K, Charles W, Zhang H, Dua PK, Novetsky AD, Chang T, Wong C, Jabara M. Osteosclerosis in idiopathic myelofibrosis is related to the overproduction of osteoprotegerin (OPG). Exp Hematol. 2004;32:905–910. - PubMed
-
- Balemans W, Ebeling M, Patel N, Van Hul E, Olson P, Dioszegi M, Lacza C, Wuyts W, Van Den Ende J, Willems P, Paes-Alves AF, Hill S, Bueno M, Ramos FJ, Tacconi P, Dikkers FG, Stratakis C, Lindpaintner K, Vickery B, Foernzler D, Van Hul W. Increased bone density in sclerosteosis is due to the deficiency of a novel secreted protein (SOST). Hum Mol Genet. 2001;10:537–543. - PubMed
-
- Pyrah LN, Hodgkinson A, Anderson CK. Primary hyperparathyroidism. Br J Surg. 1966;53:245–316. - PubMed
Publication types
MeSH terms
Substances
LinkOut - more resources
Full Text Sources
Molecular Biology Databases
Research Materials
Miscellaneous

