. 2009 Apr 24;324(5926):528-32.
doi: 10.1126/science.1167936.

Genome-wide survey of SNP variation uncovers the genetic structure of cattle breeds

Bovine HapMap ConsortiumRichard A GibbsJeremy F TaylorCurtis P Van TassellWilliam BarendseKellye A EversoleClare A GillRonnie D GreenDebora L HamernikSteven M KappesSigbjørn LienLakshmi K MatukumalliJohn C McEwanLynne V NazarethRobert D SchnabelGeorge M WeinstockDavid A WheelerPaolo Ajmone-MarsanPaul J BoettcherAlexandre R CaetanoJose Fernando GarciaOlivier HanottePaola MarianiLoren C SkowTad S SonstegardJohn L WilliamsBoubacar DialloLemecha HailemariamMario L MartinezChris A MorrisLuiz O C SilvaRichard J SpelmanWoudyalew MulatuKeyan ZhaoColette A AbbeyMorris AgabaFlábio R AraujoRowan J BunchJames BurtonChiara GorniHanotte OlivierBlair E HarrisonBill LuffMarco A MachadoJoel MwakayaGraham PlastowWarren SimTimothy SmithMerle B ThomasAlessio ValentiniPaul WilliamsJames WomackJohn A WoolliamsYue LiuXiang QinKim C WorleyChuan GaoHuaiyang JiangStephen S MooreYanru RenXing-Zhi SongCarlos D BustamanteRyan D HernandezDonna M MuznyShobha PatilAnthony San LucasQing FuMatthew P KentRichard VegaAruna MatukumalliSean McWilliamGert SclepKatarzyna BrycJungwoo ChoiHong GaoJohn J GrefenstetteBrenda MurdochAlessandra StellaRafael Villa-AnguloMark WrightJan AertsOliver JannRiccardo NegriniMike E GoddardBen J HayesDaniel G BradleyMarcos Barbosa da SilvaLilian P L LauGeorge E LiuDavid J LynnFrancesca PanzittaKen G Dodds

Genome-wide survey of SNP variation uncovers the genetic structure of cattle breeds

Bovine HapMap Consortium et al. Science. .

Abstract

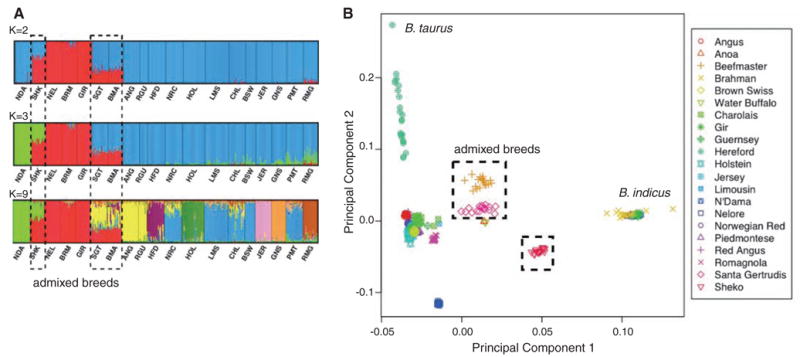
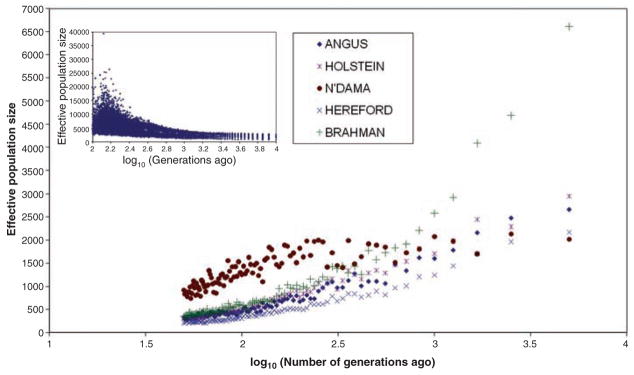
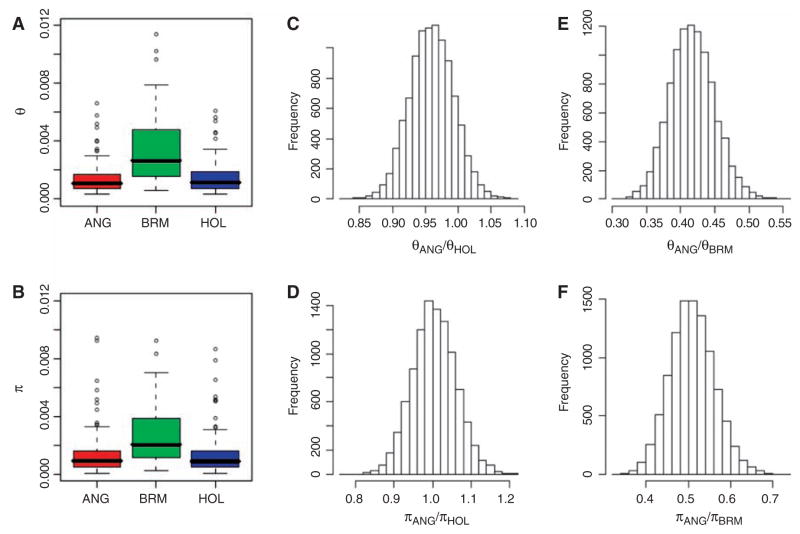
The imprints of domestication and breed development on the genomes of livestock likely differ from those of companion animals. A deep draft sequence assembly of shotgun reads from a single Hereford female and comparative sequences sampled from six additional breeds were used to develop probes to interrogate 37,470 single-nucleotide polymorphisms (SNPs) in 497 cattle from 19 geographically and biologically diverse breeds. These data show that cattle have undergone a rapid recent decrease in effective population size from a very large ancestral population, possibly due to bottlenecks associated with domestication, selection, and breed formation. Domestication and artificial selection appear to have left detectable signatures of selection within the cattle genome, yet the current levels of diversity within breeds are at least as great as exists within humans.


Figures

Fig. 1
Fig. 1
(A) Population structure assessed by InStruct. Bar plot, generated by DISTRUCT, depicts classifications with the highest probability under the model that assumes independent allele frequencies and inbreeding coefficients among assumed clusters. Each individual is represented by a vertical bar, often partitioned into colored segments with the length of each segment representing the proportion of the individual’s genome from K = 2, 3, or 9 ancestral populations. Breeds are separated by black lines. NDA, N’Dama; SHK, Sheko; NEL, Nelore; BRM, Brahman; GIR, Gir; SGT, Santa Gertrudis; BMA, Beefmaster; ANG, Angus; RGU, Red Angus; HFD, Hereford; NRC, Norwegian Red; HOL, Holstein; LMS, Limousin; CHL, Charolais; BSW, Brown Swiss; JER, Jersey; GNS, Guernsey; PMT, Piedmontese; RMG, Romagnola. (B) Principal components PC1 and PC2 from all SNPs. Taurine breeds remain separated from indicine breeds, and admixed breeds are intermediate.
Fig. 2
Fig. 2
Effective population size in the past estimated from linkage disequilibrium data. Inset graph shows effective population size for the European humans over the same period; from (13). Breeds as in Fig. 1.
Fig. 3
Fig. 3
Nucleotide diversity across five ENCODE regions resequenced in 47 animals from ANG, Angus; BRM, Brahman; and HOL, Holstein. (A) Watterson’s estimate (θ) of the population mutation rate per base pair (pooled across regions). (B) Average pairwise nucleotide distance (π) within breeds. (C and E) Non-parametric bootstrap estimates of diversity ratios among the three populations on the basis of θ. (D and F) Nonparametric bootstrap estimates of diversity ratios among the three populations on the basis of π.

Comment in

References

    1. Kappes SM, et al. J Anim Sci. 2000;78:3053. - PubMed
    1. Barendse W, et al. Genetics. 2007;176:1893. - PMC - PubMed
    1. Bradley DG, et al. Proc Natl Acad Sci USA. 1996;93:5131. - PubMed
    1. Loftus RT, et al. Mol Ecol. 1999;8:2015. - PubMed
    1. Edwards CJ, et al. Proc R Soc London B Biol Sci. 2007;274:1377. - PMC - PubMed

Publication types

Associated data

LinkOut - more resources