. 2009 Apr 15;23(8):986-96.
doi: 10.1101/gad.1773909.

Bile acid signaling pathways increase stability of Small Heterodimer Partner (SHP) by inhibiting ubiquitin-proteasomal degradation

Affiliations

Bile acid signaling pathways increase stability of Small Heterodimer Partner (SHP) by inhibiting ubiquitin-proteasomal degradation

Ji Miao et al. Genes Dev. .

Abstract

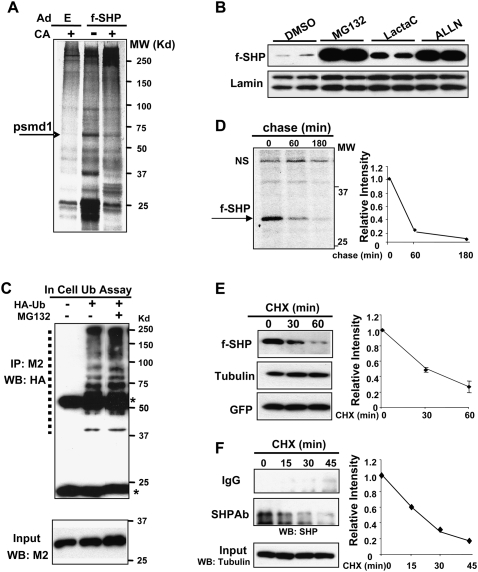
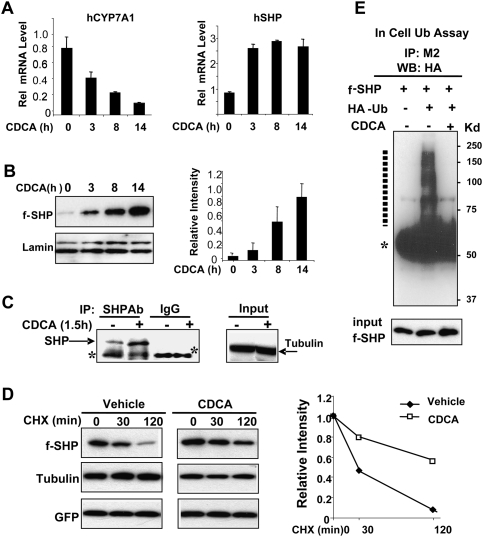
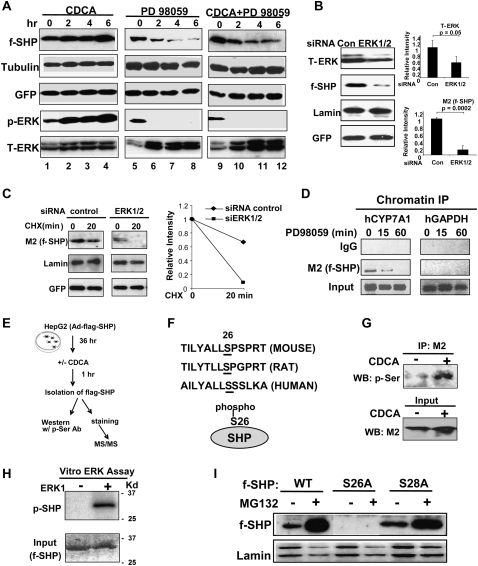
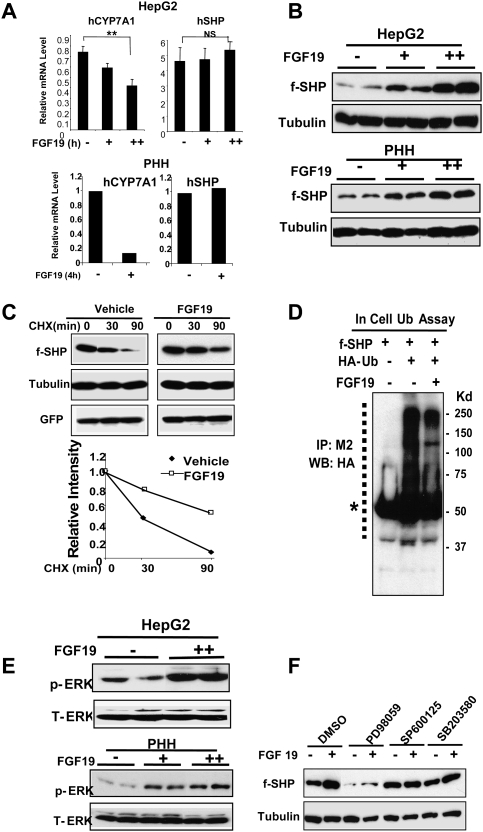
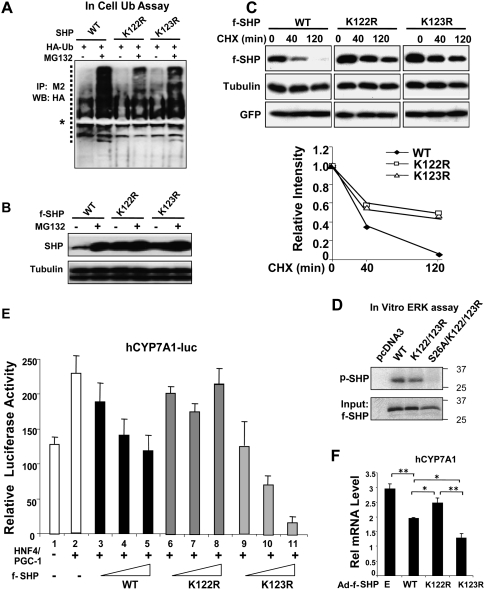
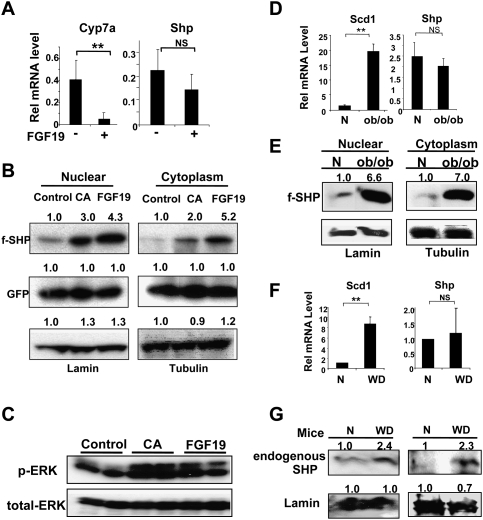
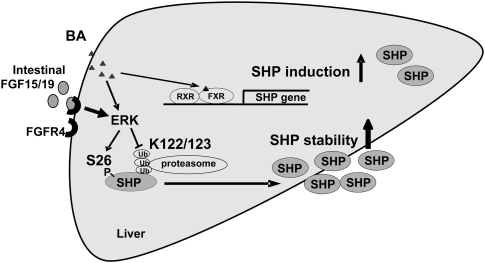
Small Heterodimer Partner (SHP) inhibits activities of numerous transcription factors involved in diverse biological pathways. As an important metabolic regulator, SHP plays a key role in maintaining cholesterol and bile acid homeostasis by inhibiting cholesterol conversion to bile acids. While SHP gene induction by increased bile acids is well established, whether SHP activity is also modulated remains unknown. Here, we report surprising findings that SHP is a rapidly degraded protein via the ubiquitin-proteasomal pathway and that bile acids or bile acid-induced intestinal fibroblast growth factor 19 (FGF19) increases stability of hepatic SHP by inhibiting proteasomal degradation in an extracellular signal-regulated kinase (ERK)-dependent manner. SHP was ubiquitinated at Lys122 and Lys123, and mutation of these sites altered its stability and repression activity. Tandem mass spectrometry revealed that upon bile acid treatment, SHP was phosphorylated at Ser26, within an ERK motif in SHP, and mutation of this site dramatically abolished SHP stability. Surprisingly, SHP stability was abnormally elevated in ob/ob mice and diet-induced obese mice. These results demonstrate an important role for regulation of SHP stability in bile acid signaling in normal conditions, and that abnormal stabilization of SHP may be associated with metabolic disorders, including obesity and diabetes.


Figures

Figure 1.
Figure 1.
SHP is rapidly degraded by the ubiquitin–proteasome pathway. (A) Experimental outlines for in vivo experiments are shown in Supplemental Figure S1. Briefly, Ad-Flag-SHP or control Ad-empty (E) was injected via the tail vein and, 5 d later, mice were fed normal (−) or CA-supplemented (+) chow for 5 h and liver extracts were prepared. Flag-SHP and associated hepatic proteins affinity-purified on M2 agarose were visualized by silver staining. One band (arrow) was identified as psmd1 by mass spectrometry. (B) HepG2 cells transfected with a Flag-SHP expression plasmid were treated with proteasome inhibitors as indicated for 6 h and subjected to Western analyses. Duplicates are shown. (C) Hepa1c cells were transfected with pcDNA3-Flag-SHP with (+) or without (−) an HA-ubiquitin plasmid and then were treated with vehicle or MG132 for 3 h. Flag-SHP was immunoprecipitated from cell extracts with M2 antibody (IP) and ubiquitinated SHP in the immunoprecipitates was detected by Western analysis (WB). Heavy and light chains of IgG are indicated by asterisks. Positions of ubiquitinated SHP proteins are indicated by a dotted line. Flag-SHP levels in the input are shown in the bottom panel. (D) HepG2 cells infected with Ad-Flag-SHP were metabolically labeled for 30 min followed by chase for the indicated times. Flag-SHP was immunoprecipitated with M2 antibody and detected by autoradiography. (NS) Nonspecific band. Band intensities were measured by densitometry and the intensities relative to the 0-min time point were plotted. (E) HepG2 cells infected with Ad-Flag-SHP were treated with CHX (10 μg/mL) for the indicated times and Flag-SHP levels were detected by Western analyses. Band intensities were quantified as in D. SEM, n = 4. (F) HepG2 cells were treated with CHX for the indicated times and endogenous SHP was immunoprecipitated with SHP antibody or IgG control and detected by Western analyses. As a control, tubulin levels were also detected.
Figure 2.
Figure 2.
CDCA treatment increases SHP stability by inhibiting ubiquitination. (A) HepG2 cells were treated with 50 μM CDCA for the indicated times and mRNA levels of CYP7A1 and SHP were measured by qRT–PCR and normalized to those of 36B4. SEM, n = 3. (B) HepG2 cells expressing Flag-SHP were treated with CDCA for the indicated times and subjected to Western analysis. The average intensity for Flag-SHP relative to the corresponding intensity for lamin was quantified. SEM, n = 4. (C) HepG2 cells were treated with vehicle or CDCA and endogenous SHP levels were detected by immunoprecipitation followed by Western analyses. The control tubulin levels were detected from the input. (D) HepG2 cells infected with Ad-Flag-SHP were treated with CHX for the indicated times in the presence of CDCA (+) or vehicle (−) and protein levels were detected by Western analyses. Band intensities were measured by densitometry and the intensities relative to the 0-min time point were plotted. Consistent results were observed from two independent CHX experiments. (E) Hepa1c cells transfected with pcDNA3-Flag-SHP with (+) or without (−) a ubiquitin plasmid were treated with vehicle or CDCA for 3 h. In-cell ubiquitination assays were done as described in the legend for Figure 1. Ubiquitinated Flag-SHP forms are indicated by a dotted line, and heavy chain of IgG is indicated by an asterisk.
Figure 3.
Figure 3.
ERK pathway is critical for SHP stability and Ser26 is the ERK target. (A) HepG2 cells infected with Ad-Flag-SHP were treated as indicated (50 μM CDCA, 10 μM PD98059) for 0, 2, 4, and 6 h and subjected to Western analysis. (B,C) HepG2 cells were transfected with siRNA (30 ng) for ERK1/2 or control siRNA and, 24 h later, cells were infected with Ad-Flag-SHP, and then, 24 h later, cells were subjected to either Western analysis (B) or CHX experiments (C). Band intensities were determined using ImageJ and the values for control samples were set to 1. Statistical significance was determined by the Student's t-test (SEM, n = 3). (D) HepG2 cells were infected with Ad-Flag-SHP and then subjected to ChIP assays using M2 antibody. Associations of Flag-SHP with the CYP7A1 promoter (−320 to +10) and control GAPDH coding region (+181 to +459) are shown. (E) Experimental outlines. (F) A predicted ERK site in mouse, rat, and human SHP is shown. Ser26 identified as the major ERK site by MS/MS is underlined. (G) Phosphorylated Ser levels in SHP were detected by Western blotting using phospho-Ser antibody. Flag-SHP levels in input are shown in the bottom panel. (H) In vitro ERK assay: Flag-SHP was expressed in HepG2 cells by adenoviral infection and purified by M2 agarose and incubated with γ32P-ATP with (+) or without (−) purified ERK. Phosphorylated SHP was detected by autoradiography and total SHP was detected by colloidal staining. (I) HepG2 cells were transfected with expression plasmids for Flag-SHP wild type, S26A, or S28A and then treated with 5 μM MG132 for 6 h, and cell extracts were subjected to Western analysis.
Figure 4.
Figure 4.
FGF19 increases SHP stability by inhibiting ubiquitination of SHP and activating ERK. (A) HepG2 cells or PHH were treated with purified recombinant FGF19 (0, 40 ng/mL [+], 100 ng/mL [++]) for 3 h, and the mRNA levels of CYP7A1 and SHP were detected by qRT–PCR and normalized to those of 36B4. SEM, n = 3. (B) HepG2 cells or PHH were infected with Ad-Flag-SHP and then treated with FGF19 for 3 h and subjected to Western analyses. Duplicates are shown. (C) HepG2 cells infected with Ad-Flag-SHP were treated with CHX for the indicated times in the presence of FGF19 (+) or vehicle (−) and subjected to Western analyses. Band intensities relative to the 0-min time point were plotted. (D) Hepa1c cells were transfected with expression plasmids as indicated and, 36 h later, cells were treated with FGF19 for 30 min and subjected to in-cell ubiquitination assays as described in the legend for Figure 1. (E) HepG2 cells were treated with FGF19 for 3 h and phosphorylated ERK (p-ERK) and total ERK (T-ERK) levels were detected by Western analyses. Duplicates are shown. (F) HepG2 cells infected with Ad-Flag-SHP were pretreated with the indicated kinase inhibitors for 30 min and further treated with FGF19 (+) or vehicle PBS (−) for 3 h and then subjected to Western analysis.
Figure 5.
Figure 5.
Lys122 and Lys123 are major ubiquitination sites in SHP. (A) Hepa1c cells transfected with expression vectors as indicated were treated with vehicle or 5 μM MG132 for 6 h and subjected to in-cell ubiquitination assays as described in the legend for Figure 1. (B) HepG2 cells were transfected with expression vectors as indicated and treated with 5 μM MG132 (+) or vehicle (−) for 6 h and then subjected to Western analysis. (C) HepG2 cells infected with Ad-Flag-SHP wild type (WT) or mutants were treated with CHX for the indicated times and subjected to Western analyses. Band intensities relative to the 0-min time point were plotted. (D) Wild-type and indicated Flag-SHP mutant proteins were synthesized using in vitro transcription and translation system. Flag-SHP was immunoprecipitated by M2 agarose and subjected to in vitro ERK kinase assay as described in the legend for Figure 3. Phosphorylated SHP was detected by autoradiography and Flag-SHP levels in the input samples were detected by Western analysis. The pcDNA3 serves a negative control. (E) HepG2 cells were cotransfected with 250 ng of CYP7A1-luc reporter and expression vectors for CMV β-galactosidase as an internal control, 100 ng of HNF-4 and PGC-1α, as well as 25–200 ng of pcDNA3-Flag-SHP wild type or mutants, and then cells were harvested for reporter assays. The triangles represent increasing amounts of the Flag-SHP vectors. The values for firefly luciferase activities were normalized by dividing by the β-galactosidase activities. SEM, n = 3. (F) HepG2 cells were infected with Ad-virus and, 36 h later, cells were further subjected to qRT–PCR. Statistical significance was measured using the Student's t-test. (*) P < 0.05; (**) P < 0.01; SEM, n = 4.
Figure 6.
Figure 6.
Hepatic SHP stability is increased by CA feeding or FGF19 treatment in vivo and is abnormally elevated in metabolic disease model mice. (A) Mice were treated with vehicle PBS (−) or FGF19 (+) via the tail vein and, 6 h later, livers were collected for qRT–PCR. (B) Mice were injected with Ad-Flag-SHP and, 5 d later, fed normal control chow or 0.5% CA-supplemented chow (CA) for 14 h, or treated with FGF19 for 6 h. Nuclear and cytoplasmic extracts were prepared and Flag-SHP and lamin (as a nuclear protein control), tubulin (as a cytoplasmic protein control), and GFP (as a monitor of infection efficiency) were detected by Western analyses. Consistent results were observed from three sets of mice. (C) Mice were fed control chow or CA chow or were injected with FGF19 and livers were collected for Western analysis. (D) Livers from normal wild-type CV57 mice (N) or ob/ob mice were collected for qRT–PCR. (E) Wild-type normal (N) or ob/ob mice were injected with Ad-Flag-SHP and, 5 d later, cytoplasmic and nuclear extracts were prepared for Western blotting. Consistent results were observed from two sets of mice. (F) Livers from normal mice (N) or mice fed a high-fat and high-calorie western-style diet (WD) for 16 wk were collected for qRT–PCR. (G) Diet-induced obese mouse model: Livers from mice fed normal chow (N) or fed a chronic western diet (WD) for 16 wk were collected. Endogenous Shp levels were detected by Western analyses using SHP antibody. Results from two sets of mice are shown. (B,E,G) Band intensities were determined using ImageJ and the values for control or normal samples were set to 1. (A,D,F) Statistical significance was determined by the Student's t-test (SEM, n = 3). (**) P < 0.01; (NS) statistically not significant.
Figure 7.
Figure 7.
Bile acids and FGF19 increase stability of hepatic SHP by inhibiting ubiquitin–proteasomal degradation and activating ERK pathway. SHP is rapidly degraded by the ubiquitin–proteasomal pathway with a half-life <30 min. Bile acids not only increase SHP gene induction by activation of the nuclear bile acid receptor FXR, but also substantially increase SHP stability by activating ERK and inhibiting proteasomal degradation. Treatment with a primary bile acid, CDCA, increases phosphorylation of SHP at Ser26 and inhibits ubiquitination at Lys122/Lys123, which results in increased SHP stability. Bile acid-induced intestinal FGF19 predominantly increases SHP stability, with little effect on SHP gene induction, by activating ERK and inhibiting ubiquitination and proteasomal degradation.

References

    1. Bavner A., Sanyal S., Gustafsson J.A., Treuter E. Transcriptional corepression by SHP: Molecular mechanisms and physiological consequences. Trends Endocrinol. Metab. 2005;16:478–488. - PubMed
    1. Boulias K., Katrakili N., Bamberg K., Underhill P., Greenfield A., Talianidis I. Regulation of hepatic metabolic pathways by the orphan nuclear receptor SHP. EMBO J. 2005;24:2624–2633. - PMC - PubMed
    1. Brooks C.L., Gu W. Ubiquitination, phosphorylation and acetylation: The molecular basis for p53 regulation. Curr. Opin. Cell Biol. 2003;15:164–171. - PubMed
    1. Chiang J.Y.L. Bile acid regulation of gene expression: Roles of nuclear hormone receptors. Endocr. Rev. 2002;23:443–463. - PubMed
    1. Deng S., Zhou H., Xiong R., Lu Y., Yan D., Xing T., Dong L., Tang E., Yang H. Over-expression of genes and proteins of ubiquitin specific peptidases (USPs) and proteasome subunits (PSs) in breast cancer tissue observed by the methods of RFDD-PCR and proteomics. Breast Cancer Res. Treat. 2007;104:21–30. - PubMed

Publication types

MeSH terms

Substances