. 2009 Apr;5(4):e1000460.
doi: 10.1371/journal.pgen.1000460. Epub 2009 Apr 24.

Control of metabolic homeostasis by stress signaling is mediated by the lipocalin NLaz

Affiliations

Control of metabolic homeostasis by stress signaling is mediated by the lipocalin NLaz

Julie Hull-Thompson et al. PLoS Genet. 2009 Apr.

Abstract

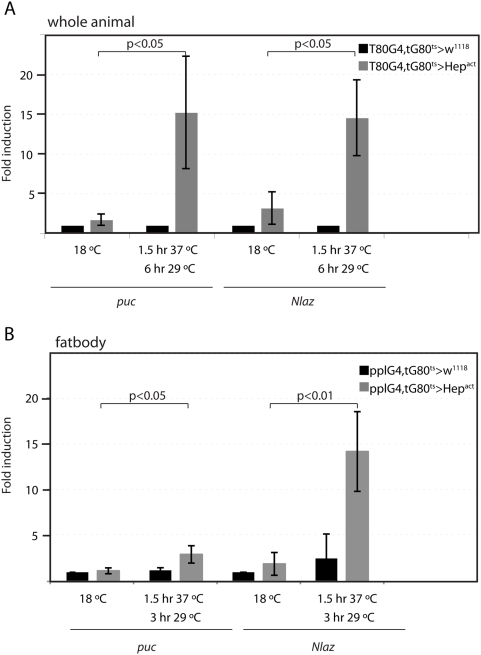
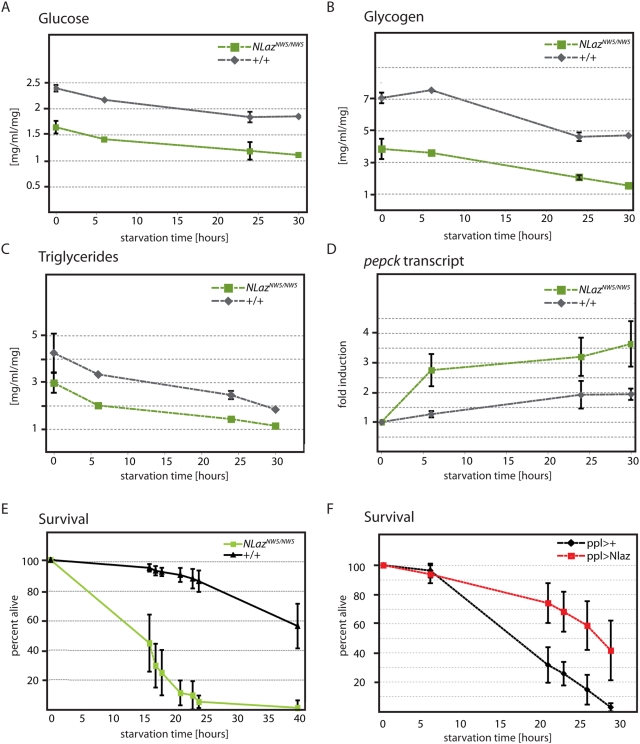
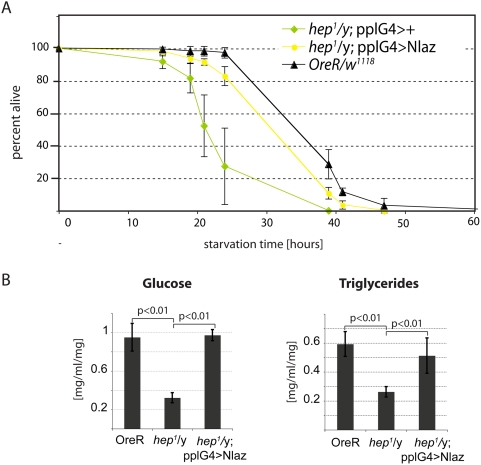
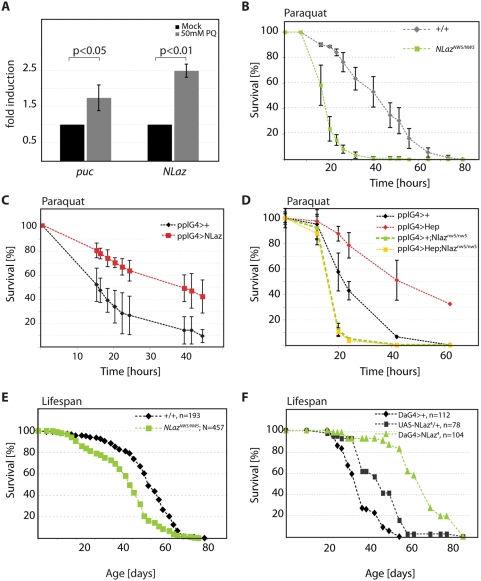
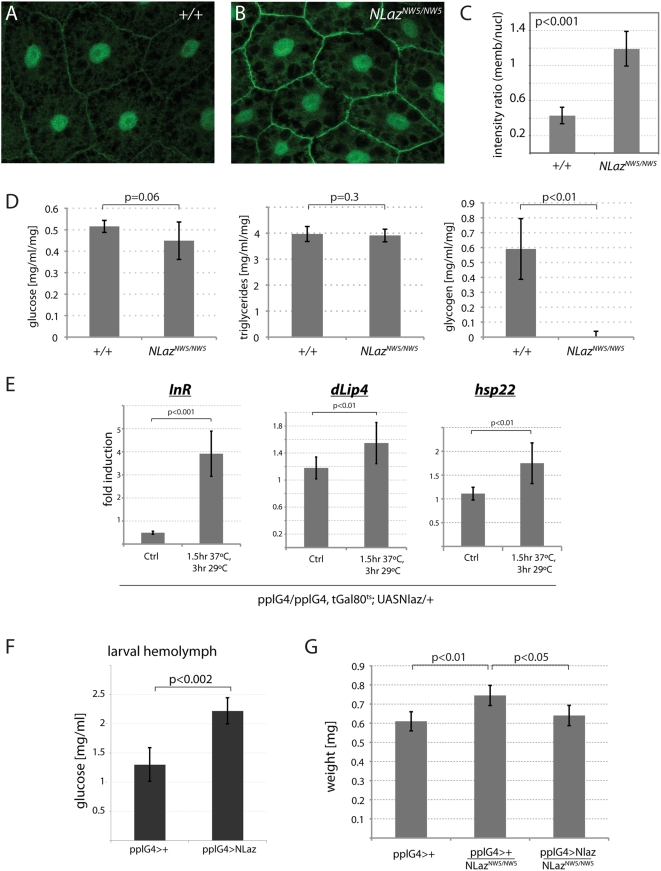
Metabolic homeostasis in metazoans is regulated by endocrine control of insulin/IGF signaling (IIS) activity. Stress and inflammatory signaling pathways--such as Jun-N-terminal Kinase (JNK) signaling--repress IIS, curtailing anabolic processes to promote stress tolerance and extend lifespan. While this interaction constitutes an adaptive response that allows managing energy resources under stress conditions, excessive JNK activity in adipose tissue of vertebrates has been found to cause insulin resistance, promoting type II diabetes. Thus, the interaction between JNK and IIS has to be tightly regulated to ensure proper metabolic adaptation to environmental challenges. Here, we identify a new regulatory mechanism by which JNK influences metabolism systemically. We show that JNK signaling is required for metabolic homeostasis in flies and that this function is mediated by the Drosophila Lipocalin family member Neural Lazarillo (NLaz), a homologue of vertebrate Apolipoprotein D (ApoD) and Retinol Binding Protein 4 (RBP4). Lipocalins are emerging as central regulators of peripheral insulin sensitivity and have been implicated in metabolic diseases. NLaz is transcriptionally regulated by JNK signaling and is required for JNK-mediated stress and starvation tolerance. Loss of NLaz function reduces stress resistance and lifespan, while its over-expression represses growth, promotes stress tolerance and extends lifespan--phenotypes that are consistent with reduced IIS activity. Accordingly, we find that NLaz represses IIS activity in larvae and adult flies. Our results show that JNK-NLaz signaling antagonizes IIS and is critical for metabolic adaptation of the organism to environmental challenges. The JNK pathway and Lipocalins are structurally and functionally conserved, suggesting that similar interactions represent an evolutionarily conserved system for the control of metabolic homeostasis.


Conflict of interest statement

The authors have declared that no competing interests exist.

Figures

Figure 1
Figure 1. JNK is required for maintenance of metabolic homeostasis.
(A–E) Comparison of hemizygous hep1 males (hep1/y) to wild type OreR males. (A–C) Carbohydrate and lipid content in homogenates prepared from populations of 10 flies prior to and after 6, 24, and 30 hours of wet starvation. All measurements were normalized to the average weight of a single fly in its population. (A) Glucose. (B) Glycogen. (C) Triglycerides. (D) Real time PCR results from cDNA prepared from starved adult males collected 6, 24, and 30 hours after wet starvation. Levels of PEPCK are compared in starved conditions to fed controls (0 hours). All transcripts are normalized to actin5C. (E,F) Percent of male flies surviving after prolonged dry starvation. Population sizes were (E) OreR: n = 151; hep1: n = 103. Lifespan differences are statistically significant (p<0.001, log rank test). (F) DaG4/+: n = 179; BskRNAi/+;DaG4/+: n = 138. p<0.001, log rank test. (F, inset) Real time PCR on cDNA prepared from BskRNAi/+;DaG4/+ larvae. Levels of Bsk are compared to DAG4/+ controls. All transcripts are normalized to rp49.
Figure 2
Figure 2. JNK regulates transcription of NLaz.
(A, B) Real time PCR measuring transcript levels of puc and NLaz in whole larvae (A) and dissected fatbody (B). Larvae express Hepact under the control of the ubiquitous T80-Gal4 driver (A) or the fatbody pplG4 driver (B) combined with tubGal80ts. Genotypes: (A) w1118; T80Gal4, tubGal80ts/UAS-Hepact; control genotype: w1118; T80Gal4, tubGal80ts/+; (B) w1118; pplGal4, tubGal80ts/UAS-Hepact; control genotype: w1118; pplGal4, tubGal80ts/+. Larvae were reared at 18°C until 96 hours after egg laying, heat shocked for 1.5 hours at 37°C and left at 29°C for 6 hours (A) or 3 hours (B) to activate the driver. Transcript levels are normalized to rp49. Averages and Standard Deviations of three independent experiments are shown. p values were calculated using Student's T test.
Figure 3
Figure 3. NLaz is required for maintenance of metabolic homeostasis.
(A–E) Comparison of homozygous NLaz loss of function mutants (NLazNW5/NW5) to wild type isogenic controls (NLazC-NW-14/C-NW-14). (A–C) Carbohydrate and lipid content in homogenates prepared from populations of 10 male flies prior to and after 6, 24, and 30 hours of wet starvation. All measurements were normalized to the average weight of a single fly in its population. (A) Glucose (B) Glycogen (C) Triglycerides. (D) Real time RT-PCR results from cDNA prepared from starved adult males collected 6, 24, and 30 hours after wet starvation. Levels of PEPCK are compared in starved conditions to fed controls (0 hours). All transcripts are normalized to actin5C. (E,F) Percent of male flies surviving after being exposed to prolonged dry starvation. Genotypes: (E) NLazCNW14/CNW14: n = 227; NLazNW5/NW5: n = 254. p<0.001, log rank test. (F) pplG4/+;+/+: n = 102; pplG4/+;UASNLaz/+: n = 115. p<0.001, log rank test. To equalize culture conditions and genetic backgrounds, sibling F1 progeny derived from out-crossed w1118; pplGal4/pplGal4 with out-crossed w1118; UAS-NLaz/+ are compared.
Figure 4
Figure 4. Nlaz acts downstream of JNK to maintain metabolic homeostasis.
(A) Percent of male flies surviving after being exposed to prolonged dry starvation. Populations are F1 progeny of crosses between hep1/FM6; pplG4/CyO females and OreR males (hep1/y; pplG4/+; n = 65) or w1118; UAS-NLaz/TM3 males (hep1/y; pplG4/UASNlaz; n = 70). Wild-type controls are F1 progeny of OreR females crossed to w1118 males (OreR/w1118; n = 181). p<0.001 (log rank test) for difference between hep1/y; ppl/+ and either of the other two populations. p = 0.629 (log rank test) for hep1/y; pplG4/UASNLaz compared to OreR/w1118. (B) Glucose and lipid content in homogenates prepared from populations of 10 male flies after 24 hours of wet starvation.
Figure 5
Figure 5. NLaz acts downstream of JNK to promote oxidative stress tolerance.
(A) NLaz is induced in flies exposed to oxidative stress. Levels of NLaz are compared using cDNA prepared from wild type OreR flies fed 50 mM paraquat in 5% sucrose to those fed 5% sucrose alone for 24 hours. Levels of puc are shown for comparison. All transcript levels are normalized to actin5C. p values are calculated using Student's T test. (B) Oxidative stress sensitivity in NLaz mutants. Survival after exposure to paraquat. NLazCNW14/CNW14 N = 70, NLazNW5/NW5 N = 117. Log rank test, p<0.001. (C) Over-expressing UAS-NLaz using the ppl-Gal4 driver promotes tolerance to paraquat. Comparison of siblings of the following genotypes: pplG4/+, n = 103; pplG4/+;UASNLaz/+, n = 134. p<0.001(log rank test). (D) Stress sensitivity of NLaz mutants cannot be improved by JNK activation. Survival after exposure to paraquat. Populations of the following genotypes and numbers of individuals were used: pplG4/+ n = 61; pplG4/UASHep n = 97; pplG4,NW5/NW5 n = 135; pplG4,NW5/UASHep,NW5 n = 59. Log rank test for pplG4/+ vs. pplG4/UASHep: p<0.001. (E and F) NLaz genedose influences lifespan. (E) Male longevity at 25°C. Groups of 20 flies per vial. NLazCNW14/CNW14 N = 193, NLazNW5/NW5 N = 457. Log-rank test, p<0.001. (F) Overexpression of NLaz increases normal survival of males at 25°C. Overexpressing UAS-NLaz4 using DaG4 as a ubiquitous driver increases mean and maximum life spans in normal conditions. DaG4/+, n = 112; UAS-NLaz4/+, n = 78; DaG4/UAS-NLaz4, n = 104; Log-rank test: p<0.001 (comparing UAS-NLaz and DaG4/UAS-NLaz).
Figure 6
Figure 6. NLaz antagonizes IIS in larvae.
(A–C) tGPH fluorescence in larval fatbodies. (A) NLazCNW14/CNW14. (B) NLazNW5/NW5. Membrane localization of tGPH is increased in NLaz mutants compared to isogenic wild-type controls, indicating elevated PI3K activity. (C) Ratios of average membrane vs. nuclear fluorescence as determined using NIH ImageJ on images of fatbody cells of independent individuals. n = 6 for NLazCNW14/CNW14, n = 10 for NLazNW5/NW5. P value from Student's T test. (D) NLaz mutant third-instar larvae (homozygotes for NLazNW5/NW5) exhibit strongly decreased Glycogen stores compared to isogenic wild-type controls (NLazCNW14/CNW14). Glucose and Triglyceride levels do not differ in wild-type or NLaz mutant larvae. (E) Established Foxo target genes are induced in response to NLaz overexpression in the larval fatbody. Real-time PCR was performed to quantify dInR, dLip4, and hsp22 transcript levels in extracts of whole third-instar larvae. Transcript levels were normalized to actin5C and ratios of transcript levels in NLaz expressing larvae (pplG4/pplG4,tubGal80ts; UASNLaz/+) and in wildtype controls (pplG4/pplG4, tubGal80ts; +/+) are shown for control conditions (18°C) and after heat-shock. p-values from Student's Ttest. (F) Over-expression of NLaz in the fatbody results in elevated hemolymph glucose levels. Experiments were performed in larvae of the following genotypes: pplG4/+;+/+; pplG4/+; UASNlaz/+. (G) Comparison of adult sibling males of the following genotypes, reared at 29°C: pplG4; +/+. pplG4,NLazNW5/NW5;+/+; pplG4,NLazNW5/NW5;UASNlaz/+. Overall weight is increased in NLaz mutants. Size is decreased again in animals over-expressing NLaz in the fatbody. Fresh weight of males of the indicated genotypes.
Figure 7
Figure 7. NLaz antagonizes IIS in adults.
(A) Foxo translocates to the nucleus in adult fatbody tissue in response to NLaz induction. Confocal images of adult female fatbodies immustained for Foxo (red). DNA is visualized using DAPI (blue in the overlay). The monochrome panels show only Foxo signal. Adult flies (females and males, females are shown here) of the indicated genotypes were reared at 18°C and heat-shocked as indicated. (B) The Foxo target gene dLio4 is induced in response to NLaz induction. Real-time PCR was performed to quantify dLip4 transcript levels in extracts of whole adult male NLaz-expressing flies and in wildtype controls (Genotypes as in A). Transcript levels were normalized to actin5C and ratio of transcript levels in NLaz expressing vs wild-type flies is shown for control conditions (18°C) and after heat-shock. P-value from Student's Ttest. (C) Fatbody-specific expression of NLaz induces changes in tGPH levels in nurse cells. Egg chambers of flies of the indicated genotypes are shown, tGPH fluorescence was determined by confocal microscopy. GFP-PH levels at the Nurse Cell boundaries are reduced in NLaz expressing flies after heatshock (arrowheads). (D) NLaz cannot promote further starvation tolerance of chico1 mutant flies. Percent survival of males of the following genotypes in response to prolonged dry starvation: +/+, n = 112; chico/+, n = 124, chico/pplG4, n = 122; chico/pplG4;UASNLaz/+, n = 124; chico/+;UASNLaz/+, n = 78. Log rank: p<0.001 for all populations compared to +/+. (E) Proposed role of NLaz in promoting stress tolerance and metabolic homeostasis in the fly. JNK-mediated induction of NLaz in the fatbody is required for regulation of metabolic homeostasis and stress tolerance. Accordingly, NLaz over-expression promotes stress tolerance and extends lifespan. As suggested by our data and reported for related vertebrate Lipocalins, NLaz might interfere with Insulin signaling activity, thus coordinating metabolic changes throughout the organism. At the same time, JNK represses transcription of dilp2 in IPCs. Together, these two mechanisms antagonize IIS in the periphery, thereby promoting stress tolerance systemically.

References

    1. Kloting N, Bluher M. Extended longevity and insulin signaling in adipose tissue. Exp Gerontol. 2005;40:126–133. - PubMed
    1. Kahn SE, Hull RL, Utzschneider KM. Mechanisms linking obesity to insulin resistance and type 2 diabetes. Nature. 2006;444:840–846. - PubMed
    1. Russell SJ, Kahn CR. Endocrine regulation of ageing. Nat Rev Mol Cell Biol. 2007;8:681–691. - PubMed
    1. Wang MC, Bohmann D, Jasper H. JNK extends life span and limits growth by antagonizing cellular and organism-wide responses to insulin signaling. Cell. 2005;121:115–125. - PubMed
    1. van der Pluijm I, Garinis GA, Brandt RM, Gorgels TG, Wijnhoven SW, et al. Impaired genome maintenance suppresses the growth hormone–insulin-like growth factor 1 axis in mice with Cockayne syndrome. PLoS Biol. 2007;5:e2. - PMC - PubMed

Publication types

MeSH terms