. 2009 Apr;5(4):e1000367.
doi: 10.1371/journal.pcbi.1000367. Epub 2009 Apr 24.

A structural model of the pore-forming region of the skeletal muscle ryanodine receptor (RyR1)

Affiliations

A structural model of the pore-forming region of the skeletal muscle ryanodine receptor (RyR1)

Srinivas Ramachandran et al. PLoS Comput Biol. 2009 Apr.

Abstract

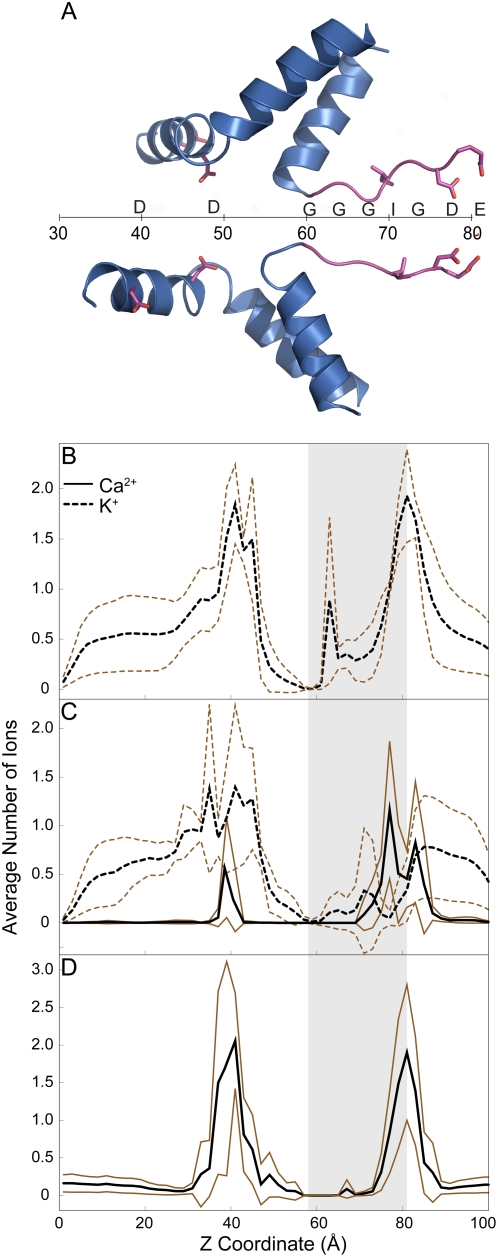
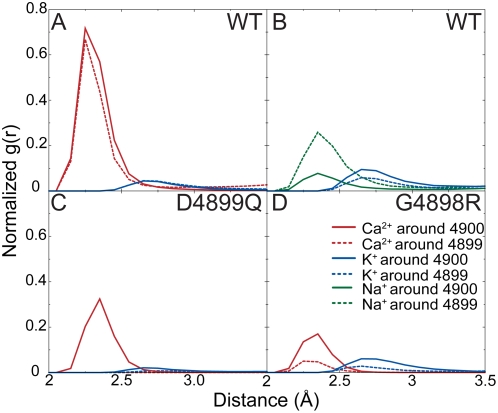
Ryanodine receptors (RyRs) are ion channels that regulate muscle contraction by releasing calcium ions from intracellular stores into the cytoplasm. Mutations in skeletal muscle RyR (RyR1) give rise to congenital diseases such as central core disease. The absence of high-resolution structures of RyR1 has limited our understanding of channel function and disease mechanisms at the molecular level. Here, we report a structural model of the pore-forming region of RyR1. Molecular dynamics simulations show high ion binding to putative pore residues D4899, E4900, D4938, and D4945, which are experimentally known to be critical for channel conductance and selectivity. We also observe preferential localization of Ca(2+) over K(+) in the selectivity filter of RyR1. Simulations of RyR1-D4899Q mutant show a loss of preference to Ca(2+) in the selectivity filter as seen experimentally. Electrophysiological experiments on a central core disease mutant, RyR1-G4898R, show constitutively open channels that conduct K(+) but not Ca(2+). Our simulations with G4898R likewise show a decrease in the preference of Ca(2+) over K(+) in the selectivity filter. Together, the computational and experimental results shed light on ion conductance and selectivity of RyR1 at an atomistic level.


Conflict of interest statement

The authors have declared that no competing interests exist.

Figures

Figure 1
Figure 1. The pore model.
(A) Two opposing RyR1 monomers shown in cartoon representation. The selectivity filter (the motif 4894GGGIGDE) is shown in yellow. (B) Selectivity filter region of two opposing RyR1 monomers shown in stick representation. The sequence of the fragment is shown along the path of the ions. The molecular surface of the luminal face (C) and the cytoplasmic face (D) of RyR1 pore tetramer. Negative residues are shown in red while positive residues are shown in blue and the neutral residues are shown in white. This figure was created using PyMOL (http://pymol.sourceforge.net/).
Figure 2
Figure 2. Ion permeation properties of RyR1-WT (top), RyR1-D4899Q (middle), and RyR1-G4898R (bottom) ion channels.
Upper traces represent single channel currents (openings shown as downward deflections from the closed state (c–) recorded in symmetrical 250 mM KCl and 5 µM free Ca2+ cis. Bottom traces represent single channel currents recorded at 0 mV following the addition of 10 mM trans Ca2+.
Figure 3
Figure 3. Histogram of ion occupancies along the axis of the channel.
(A) Schematic of the pore axis and the positions of residues along the pore axis. (B) RyR1-WT in 250 mM KCl. (C) RyR1-WT in 250 mM KCl and 70 mM CaCl2. (D) RyR1-WT with 125 mM CaCl2. The region corresponding to selectivity filter is shaded in the plots. This region was determined from the distribution of z coordinates of Cα of G4894 and the carboxyl group of E4900 from each of the simulations. The average occupancy from 4 simulations is plotted in black, while lines corresponding to ±1 SD are plotted in brown.
Figure 4
Figure 4. Radial distribution function (RDF) of ions around the carbonyl oxygens of 4899 and 4900.
(A) RyR1-WT in 250 mM KCl and 70 mM CaCl2. (B) RyR1-WT in 250 mM KCl and 70 mM NaCl. (C) RyR1-D4899Q in 250 mM KCl and 70 mM CaCl2. (D) RyR1-G4898R in 250 mM KCl and 70 mM CaCl2. The plots represent distribution of the number of ions at a distance r from the centre of the carboxyl groups (amide group in Q) of D4899 and E4900. The graph axis starts at 2 Å and the peak occurs at the sum of van der Waal's radii of oxygen and the ion. The average occupancy from 4 simulations is plotted.
Figure 5
Figure 5. Histogram of ion occupancies along the axis of the mutant channels.
(A) RyR1-G4898R in 250 mM KCl. (B) RyR1-G4898R in 250 mM KCl and 70 mM CaCl2. (C) RyR1-D4899Q in 250 mM KCl. (D) RyR1-D4899Q in 250 mM KCl and 70 mM CaCl2. The shaded region in the plots corresponds to the selectivity filter, determined the same way as in Figure 4. The average occupancy from 4 simulations is plotted in black, while lines corresponding to ±1 SD are plotted in brown.

References

    1. Fill M, Copello JA. Ryanodine receptor calcium release channels. Physiol Rev. 2002;82:893–922. - PubMed
    1. Franzini-Armstrong C, Protasi F. Ryanodine receptors of striated muscles: a complex channel capable of multiple interactions. Physiol Rev. 1997;77:699–729. - PubMed
    1. Liu QY, Lai FA, Rousseau E, Jones RV, Meissner G. Multiple conductance states of the purified calcium release channel complex from skeletal sarcoplasmic reticulum. Biophys J. 1989;55:415–424. - PMC - PubMed
    1. Dirksen RT, Avila G. Altered ryanodine receptor function in central core disease: leaky or uncoupled Ca2+ release channels? Trends Cardiovasc Med. 2002;12:189–197. - PubMed
    1. Wang Y, Xu L, Pasek DA, Gillespie D, Meissner G. Probing the role of negatively charged amino acid residues in ion permeation of skeletal muscle ryanodine receptor. Biophys J. 2005;89:256–265. - PMC - PubMed

Publication types

MeSH terms

Substances