. 2009 Apr;5(4):e1000395.
doi: 10.1371/journal.ppat.1000395. Epub 2009 Apr 24.

Compartmentalized human immunodeficiency virus type 1 originates from long-lived cells in some subjects with HIV-1-associated dementia

Affiliations

Compartmentalized human immunodeficiency virus type 1 originates from long-lived cells in some subjects with HIV-1-associated dementia

Gretja Schnell et al. PLoS Pathog. 2009 Apr.

Abstract

Human immunodeficiency virus type 1 (HIV-1) invades the central nervous system (CNS) shortly after systemic infection and can result in the subsequent development of HIV-1-associated dementia (HAD) in a subset of infected individuals. Genetically compartmentalized virus in the CNS is associated with HAD, suggesting autonomous viral replication as a factor in the disease process. We examined the source of compartmentalized HIV-1 in the CNS of subjects with HIV-1-associated neurological disease and in asymptomatic subjects who were initiating antiretroviral therapy. The heteroduplex tracking assay (HTA), targeting the variable regions of env, was used to determine which HIV-1 genetic variants in the cerebrospinal fluid (CSF) were compartmentalized and which variants were shared with the blood plasma. We then measured the viral decay kinetics of individual variants after the initiation of antiretroviral therapy. Compartmentalized HIV-1 variants in the CSF of asymptomatic subjects decayed rapidly after the initiation of antiretroviral therapy, with a mean half-life of 1.57 days. Rapid viral decay was also measured for CSF-compartmentalized variants in four HAD subjects (t(1/2) mean = 2.27 days). However, slow viral decay was measured for CSF-compartmentalized variants from an additional four subjects with neurological disease (t(1/2) range = 9.85 days to no initial decay). The slow decay detected for CSF-compartmentalized variants was not associated with poor CNS drug penetration, drug resistant virus in the CSF, or the presence of X4 virus genotypes. We found that the slow decay measured for CSF-compartmentalized variants in subjects with neurological disease was correlated with low peripheral CD4 cell count and reduced CSF pleocytosis. We propose a model in which infiltrating macrophages replace CD4(+) T cells as the primary source of productive viral replication in the CNS to maintain high viral loads in the CSF in a substantial subset of subjects with HAD.


Conflict of interest statement

The authors have declared that no competing interests exist.

Figures
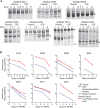
Figure 1
Figure 1. Longitudinal HTA analysis and HIV-1 decay in the blood plasma and CSF of asymptomatic subjects.
(A) Longitudinal V1/V2 or V4/V5 HTA analysis of HIV-1 using paired blood plasma and CSF samples from 7 asymptomatic subjects that were initiating antiretroviral therapy. The HTA shown for subject 4014 targeted the V1/V2 region of env, and the V4/V5 HTA is shown for all other subjects. Sample time points are listed above each HTA gel as days on HAART (DOH) with day 0 indicating the day that antiretroviral therapy was started. CSF-compartmentalized variants are indicated with a filled black circle next to the gel image. The V4/V5 HTA analysis for subject 4021 revealed a compartmentalized variant in the day 5 CSF sample, not present in the blood plasma, that was reproducible by HTA; however, the relative abundance of this variant (3.6%) was less than that of other bands detected in the same sample that were not reproducible by HTA, indicating that the detection of this band may be due to inefficient sampling and low viral load. Compartmentalized variants were not detected for three subjects. (B) HIV-1 decay kinetics in the blood plasma and CSF. Viral variants in the CSF were categorized as either compartmentalized or shared between the plasma and CSF for the decay analysis. Total plasma viral load decay is shown in red, CSF-compartmentalized variant decay is denoted by the solid blue line, and decay of variants shared between the plasma and CSF is shown by the dashed blue line. It should be noted that in our decay analysis for subject 4012 we assumed the viral load at day 0 would be similar to the viral load measured for the baseline samples at day −9.
Figure 2
Figure 2. Longitudinal HTA analysis and HIV-1 decay in blood plasma and CSF of neurologically symptomatic subjects.
(A) Longitudinal V4/V5 HTA analysis of HIV-1 in paired blood plasma and CSF samples from 1 subject with MCMD (subject 4013) and 7 subjects with HIV-associated dementia that were initiating HAART. Plasma (P) and CSF sample time points are listed above each HTA gel as days on HAART (DOH), and day 0 indicates the start of antiretroviral therapy. CSF-compartmentalized variants are indicated by a filled black circle. (B, C) HIV-1 decay kinetics in the blood plasma and CSF viral populations. Viral variants in the CSF were categorized as either compartmentalized in the CSF or shared between the plasma and CSF. Total plasma viral load decay is shown in red, CSF-compartmentalized variant decay is denoted by the solid blue line, and decay of variants shared between the plasma and CSF is shown by the dashed blue line. Four subjects (4033, 5003, 7036, 4051) displayed rapid decay in their CSF-compartmentalized variant population (shown in panel B), while the other four subjects (4013, 5002, 4059, 7115) had slower decay of CSF-compartmentalized variants (shown in panel C). Subjects 4013, 5002, and 7115 showed differential decay of CSF-compartmentalized variants where initially the compartmentalized variant population decreased very slowly (4013) or increased (5002, 7115) after the start of therapy, and at subsequent time points began decreasing at a faster rate (panel C). In our decay analysis for subjects 4051 and 7115 we assumed that the viral load at day 0 would be similar to the viral load measured for the baseline samples at day −9 for subject 4051 and at day −25 for subject 7115. In this regard, subject 7115 was followed longitudinally for several years prior to the start of antiretroviral therapy, and the viral loads in both the plasma and CSF samples remained relatively constant over time (data not shown).
Figure 3
Figure 3. Summary of HIV-1 half-lives from asymptomatic and neurologically symptomatic subjects.
Half-lives were calculated for total plasma viral load decay (Plasma), total CSF viral load decay (CSF), and CSF-compartmentalized variant decay (CSF compartmentalized variants). The half-lives were calculated using the time points when the variant load initially dropped after each subject initiated antiretroviral therapy. All half-lives listed in the figure are the average calculated from decay analyses of two independent HTA replicates. Half-lives are listed for the seven new asymptomatic subjects analyzed in this study plus four asymptomatic subjects (labeled as 4 Asy.) that were previously reported , 1 subject with MCMD (subject 4013), and 7 subjects with HIV-1–associated dementia. The asymptomatic subjects include: 4012 (open green square), 4030 (open yellow-green diamond), 5005 (brown square), 4023 (green plus symbol), 4022 (open, inverted blue triangle), 4014 (orange rectangle), 4021 (open fuchsia triangle), and 4 Asy. (gray circles). The subjects with HIV-associated neurological disease include: 4033 (purple triangle), 5003 (inverted green triangle), 7036 (teal circle), 4051 (open purple circle), 4013 (blue square), 5002 (red diamond), 4059 (black×symbol), and 7115 (black irregular circle). Two different half-lives are listed for subjects 4013, 5002, and 7115 for both total CSF viral decay (CSF) and CSF-compartmentalized variant decay (CSF-compartmentalized variants). Each of these three subjects showed biphasic decay by HTA analysis, and the half-life data point denoted with the asterisk represents the phase 1 half-life (slower), while the half-life lacking the asterisk was calculated for phase 2 of decay (faster). The CSF-compartmentalized variant population increased initially for subjects 5002 and 7115, so there was no decay detected for these subjects during phase 1 and their half-lives are listed on the graph as >30 days. Similarly, the total CSF viral load increased for subject 5002 during phase 1 of decay and the half-life is listed on the graph as >30 days.
Figure 4
Figure 4. Examination of the V3 region of env using the biotin-V3 HTA.
(A) Biotin-V3 HTA analysis of the baseline samples collected for asymptomatic and neurologically symptomatic subjects. Plasma samples (P) were analyzed for all subjects, and CSF samples (C) were analyzed for HAD subjects. The asterisk indicates the double-stranded probe band, and shifted heteroduplex bands are noted with arrowheads and numbers. (B) Summary table of the V3 sequence information obtained using the biotin-V3 HTA procedure. The desired V3 bands were excised from the dried gel, the query strand DNA was purified and PCR amplified, and the V3 PCR products from each band were sequenced. The sample type (P/C; P = plasma sample, C = CSF sample), relative abundance (Rel. Ab.), and PSSM score (0 = R5-like sequence, 1 = X4-like sequence, N/A = not applicable) for each sequence are listed in the table. Note: the V3 PCR primers used to amplify the V3 products extend into the first four and the last three amino acids of the V3 sequence. The V3 sequences provided do not include these amino acids; however, we added the JRFL consensus amino acid sequence to the beginning (CTRP) and end (AHC) of each V3 sequence to predict coreceptor usage using PSSM. Mixtures in the sequence peaks were detected at specific positions in V3 bands from subject 4051 plasma and CSF samples, and these mixtures are noted in the reported amino acid sequences.
Figure 5
Figure 5. Model of HIV-1 infection in the central nervous system.
CD4+ T cells are represented by open circles, macrophages are represented by the irregularly shaped cells, monocytes are represented by open circles labeled with an M, blood plasma viral variants are represented by the red virus particles, and CNS compartmentalized viral variants are represented by the blue virus particles. (A) HIV-1 infection in the CNS of a subset of asymptomatic subjects without detectable compartmentalized virus or CSF pleocytosis. All HIV-1 detected in the CSF decays rapidly after the initiation of therapy, suggesting that CSF virus is coming from a short-lived cell type. (B) HIV-1 infection in the CNS of asymptomatic and neurologically symptomatic subjects with compartmentalization, high CSF pleocytosis and rapid viral decay. In this model, local CNS virus is able to replicate to higher titers during periods of immunodeficiency and stimulate an inflammatory response in the CNS. Uninfected CD4+ T cells that migrate into the CNS can become infected by compartmentalized HIV-1 produced by macrophages and microglia in the CNS, and then amplify the local CNS-compartmentalized virus to higher concentrations. Thus, a rapid decay rate for compartmentalized virus is detected after the initiation of antiretroviral therapy. (C) HIV-1 infection in the CNS of neurologically symptomatic subjects with slow viral decay. Our data indicate that compartmentalized variants in the CSF of HAD subjects are originating from long-lived macrophages and microglia in the CNS, resulting in a slow decay rate for compartmentalized virus. We propose that periods of profound immunodeficiency allow compartmentalized virus in the CNS to replicate to high titers, and that in the absence of other lymphocytes (such as CD4+ T cells) peripheral, uninfected monocytes may migrate into the brain parenchyma in large numbers and differentiate into perivascular macrophages. These macrophages can then become infected by compartmentalized HIV-1 variants in the CNS and support viral replication at detectable levels.

References

    1. Boisse L, Gill MJ, Power C. HIV infection of the central nervous system: clinical features and neuropathogenesis. Neurol Clin. 2008;26:799–819. - PubMed
    1. Gonzalez-Scarano F, Martin-Garcia J. The neuropathogenesis of AIDS. Nat Rev Immunol. 2005;5:69–81. - PubMed
    1. Maslin CL, Kedzierska K, Webster NL, Muller WA, Crowe SM. Transendothelial migration of monocytes: the underlying molecular mechanisms and consequences of HIV-1 infection. Curr HIV Res. 2005;3:303–317. - PubMed
    1. Nottet HS, Persidsky Y, Sasseville VG, Nukuna AN, Bock P, et al. Mechanisms for the transendothelial migration of HIV-1-infected monocytes into brain. J Immunol. 1996;156:1284–1295. - PubMed
    1. Gorry PR, Bristol G, Zack JA, Ritola K, Swanstrom R, et al. Macrophage tropism of human immunodeficiency virus type 1 isolates from brain and lymphoid tissues predicts neurotropism independent of coreceptor specificity. J Virol. 2001;75:10073–10089. - PMC - PubMed

Publication types

MeSH terms

Substances