

Influence relevance voting: an accurate and interpretable virtual high throughput screening method
- PMID: 19391629
- PMCID: PMC2750043
- DOI: 10.1021/ci8004379
Influence relevance voting: an accurate and interpretable virtual high throughput screening method
Abstract
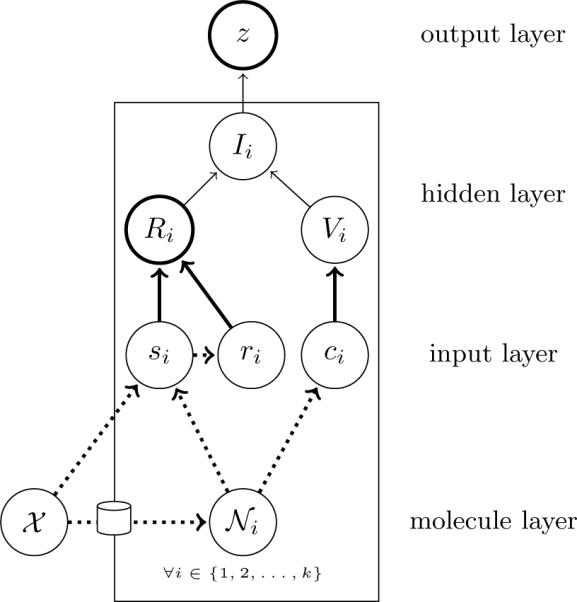
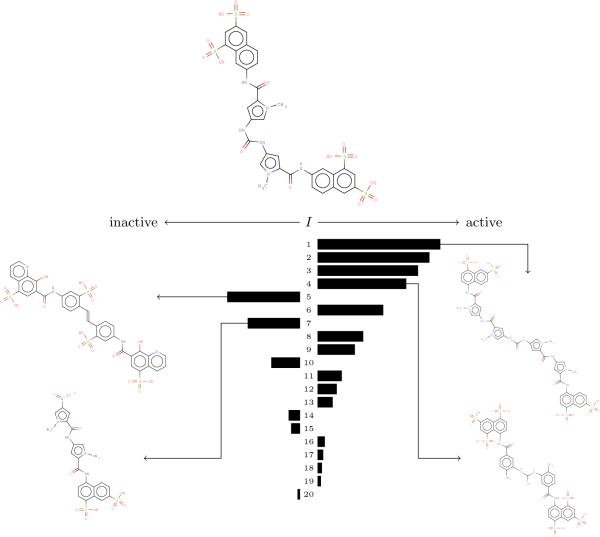
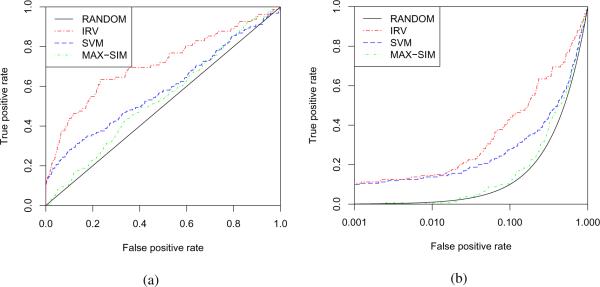
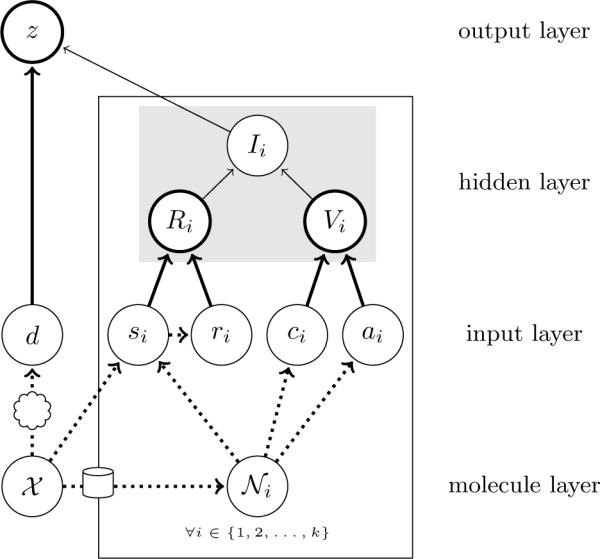
Given activity training data from high-throughput screening (HTS) experiments, virtual high-throughput screening (vHTS) methods aim to predict in silico the activity of untested chemicals. We present a novel method, the Influence Relevance Voter (IRV), specifically tailored for the vHTS task. The IRV is a low-parameter neural network which refines a k-nearest neighbor classifier by nonlinearly combining the influences of a chemical's neighbors in the training set. Influences are decomposed, also nonlinearly, into a relevance component and a vote component. The IRV is benchmarked using the data and rules of two large, open, competitions, and its performance compared to the performance of other participating methods, as well as of an in-house support vector machine (SVM) method. On these benchmark data sets, IRV achieves state-of-the-art results, comparable to the SVM in one case, and significantly better than the SVM in the other, retrieving three times as many actives in the top 1% of its prediction-sorted list. The IRV presents several other important advantages over SVMs and other methods: (1) the output predictions have a probabilistic semantic; (2) the underlying inferences are interpretable; (3) the training time is very short, on the order of minutes even for very large data sets; (4) the risk of overfitting is minimal, due to the small number of free parameters; and (5) additional information can easily be incorporated into the IRV architecture. Combined with its performance, these qualities make the IRV particularly well suited for vHTS.
Figures

References
-
- Karakoc E, Cherkasov A, Sahinalp SC. Distance Based Algorithms For Small Biomolecule Classification And Structural Similarity Search. Bioinformatics. 2006;22:243. - PubMed
-
- Zheng W, Tropsha A. Novel Variable Selection Quantitative Structure-Property Relationship Approach Based on the k-Nearest-Neighbor Principle. J. Chem. Inf. Comput. Sci. 2000;40:185–194. - PubMed
-
- Cannon EO, Bender A, Palmer DS, Mitchell JBO. Chemoinformatics-Based Classification of Prohibited Substances Employed for Doping in Sport. J. Chem. Inf. Model. 2006;46:2369–2380. - PubMed
-
- Geppert H, Horvath T, Gartner T, Wrobel S, Bajorath J. Support-Vector-Machine-Based Ranking Significantly Improves the Effectiveness of Similarity Searching Using 2D Fingerprints and Multiple Reference Compounds. J. Chem. Inf. Model. 2008;48:742–746. - PubMed
-
- Plewczynski D, Spieser SAH, Koch U. Assessing Different Classification Methods for Virtual Screening. J. Chem. Inf. Model. 2006;46:1098–1106. - PubMed
Publication types
MeSH terms
Substances
Grants and funding
LinkOut - more resources
Full Text Sources
Other Literature Sources
